Generalization techniques for points, lines and areas
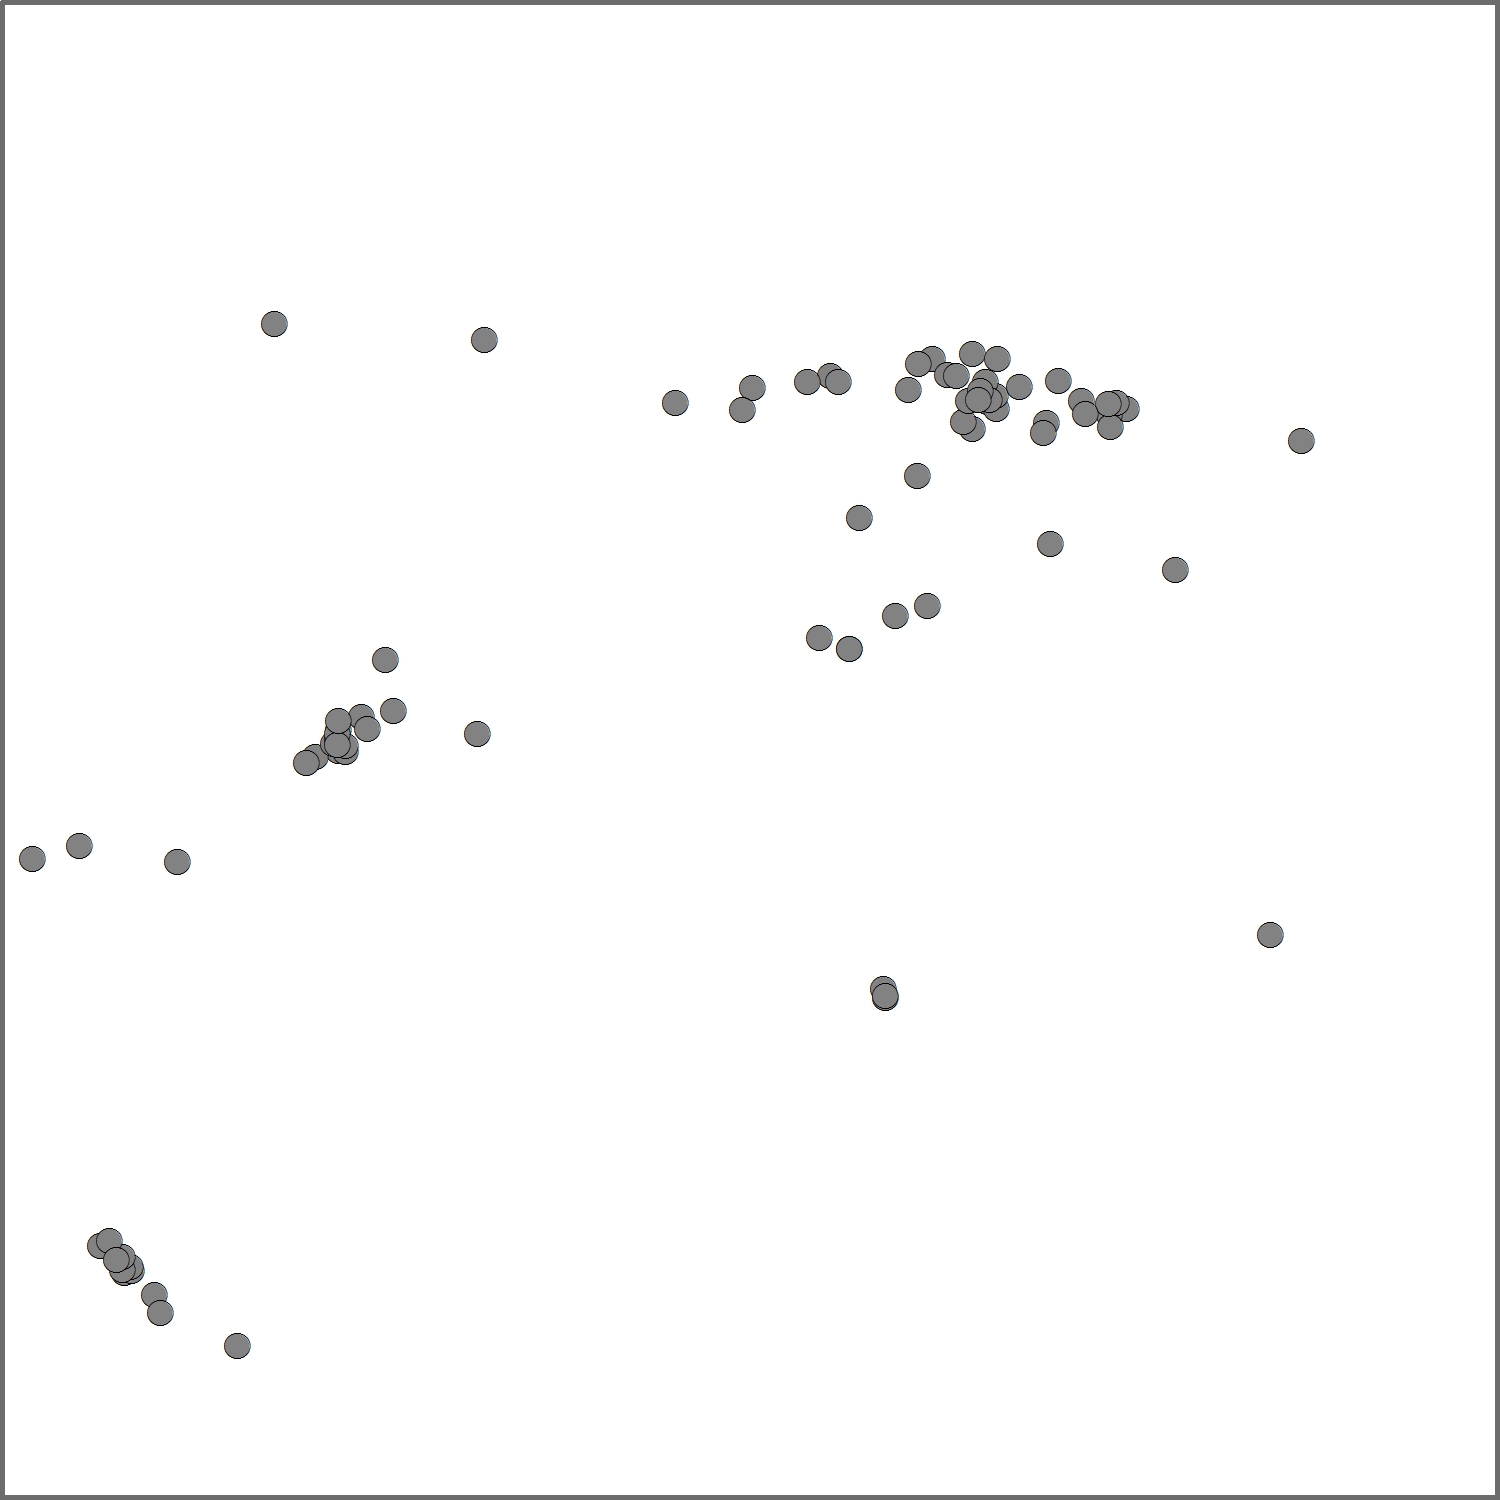
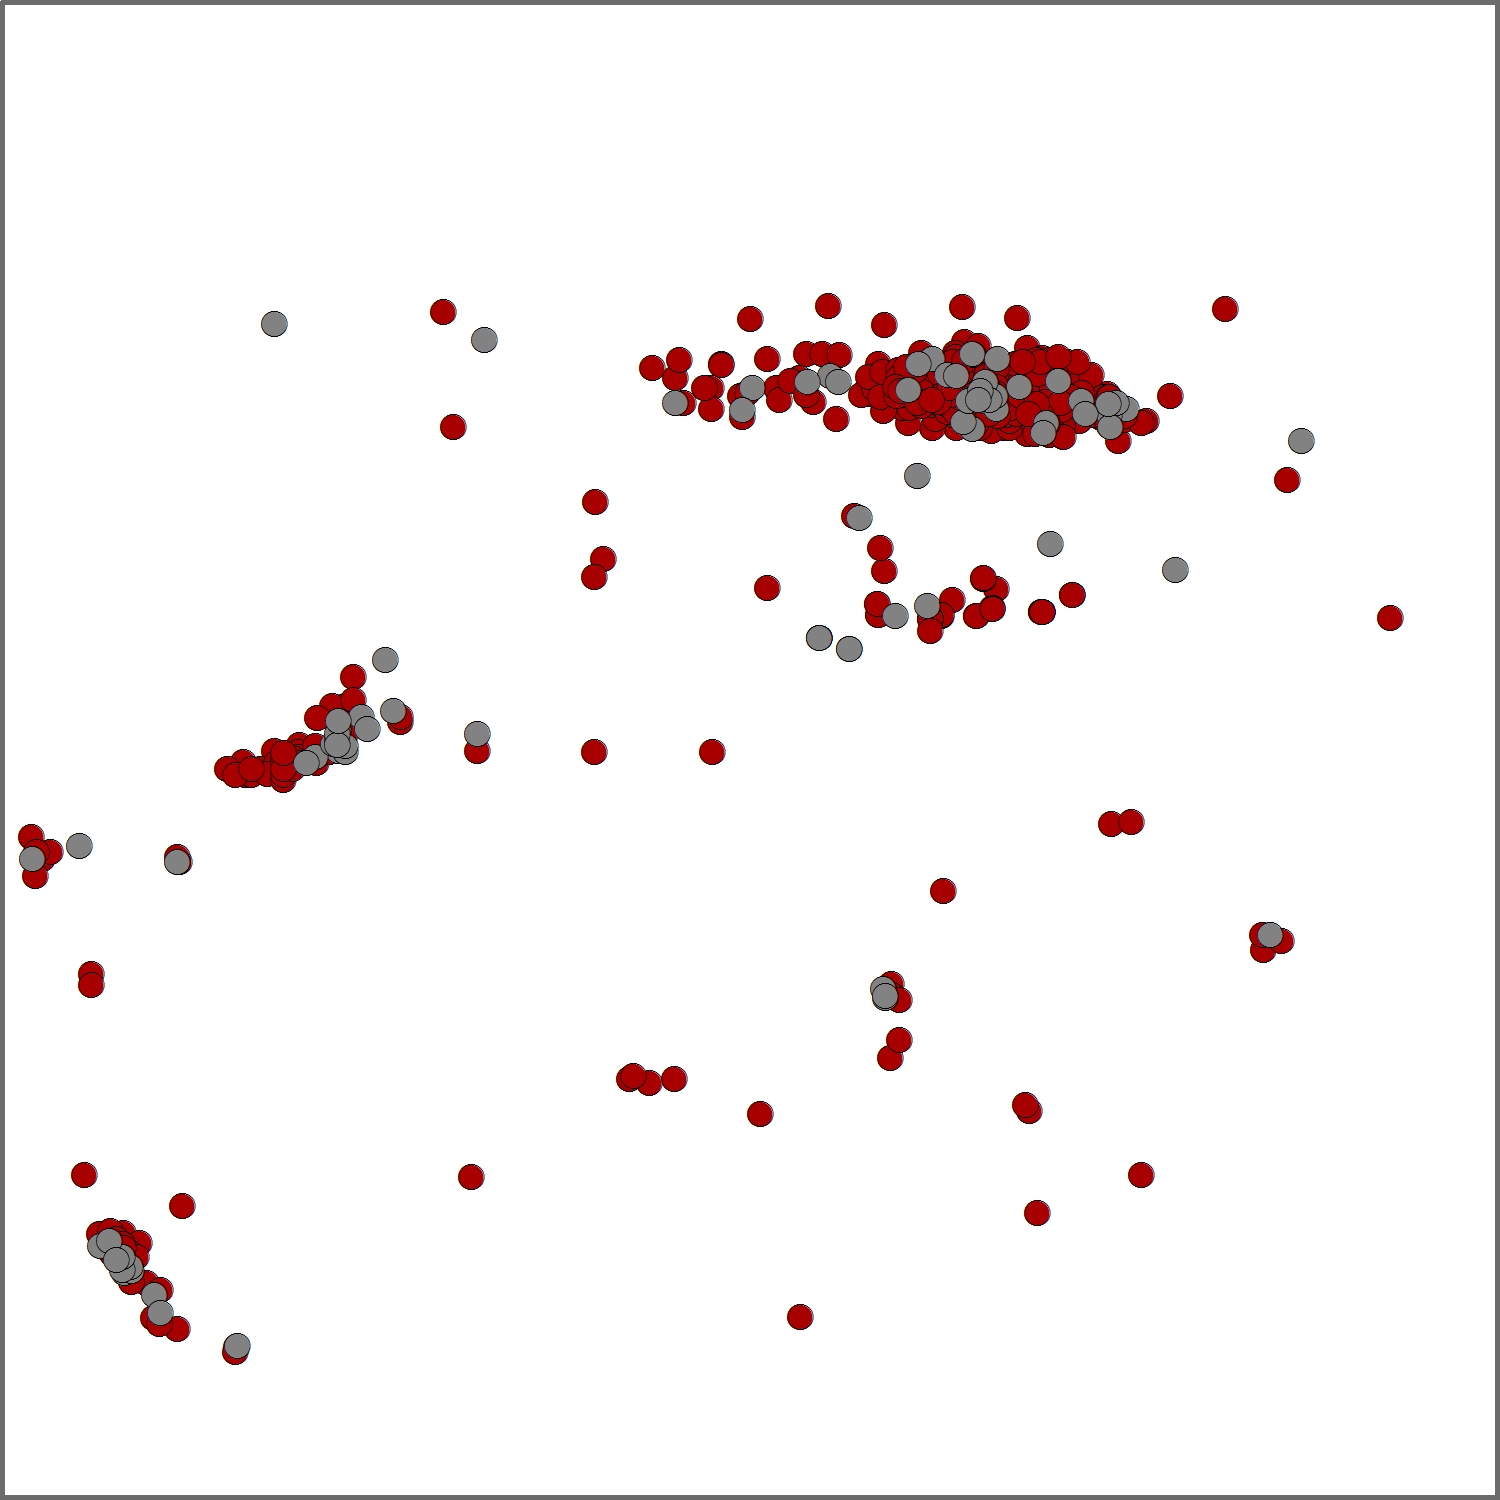
Figure 3: Hover cursor over graphic to view the results of feature elimination (Data source: Wyoming Oil and Gas Conservation Commission).
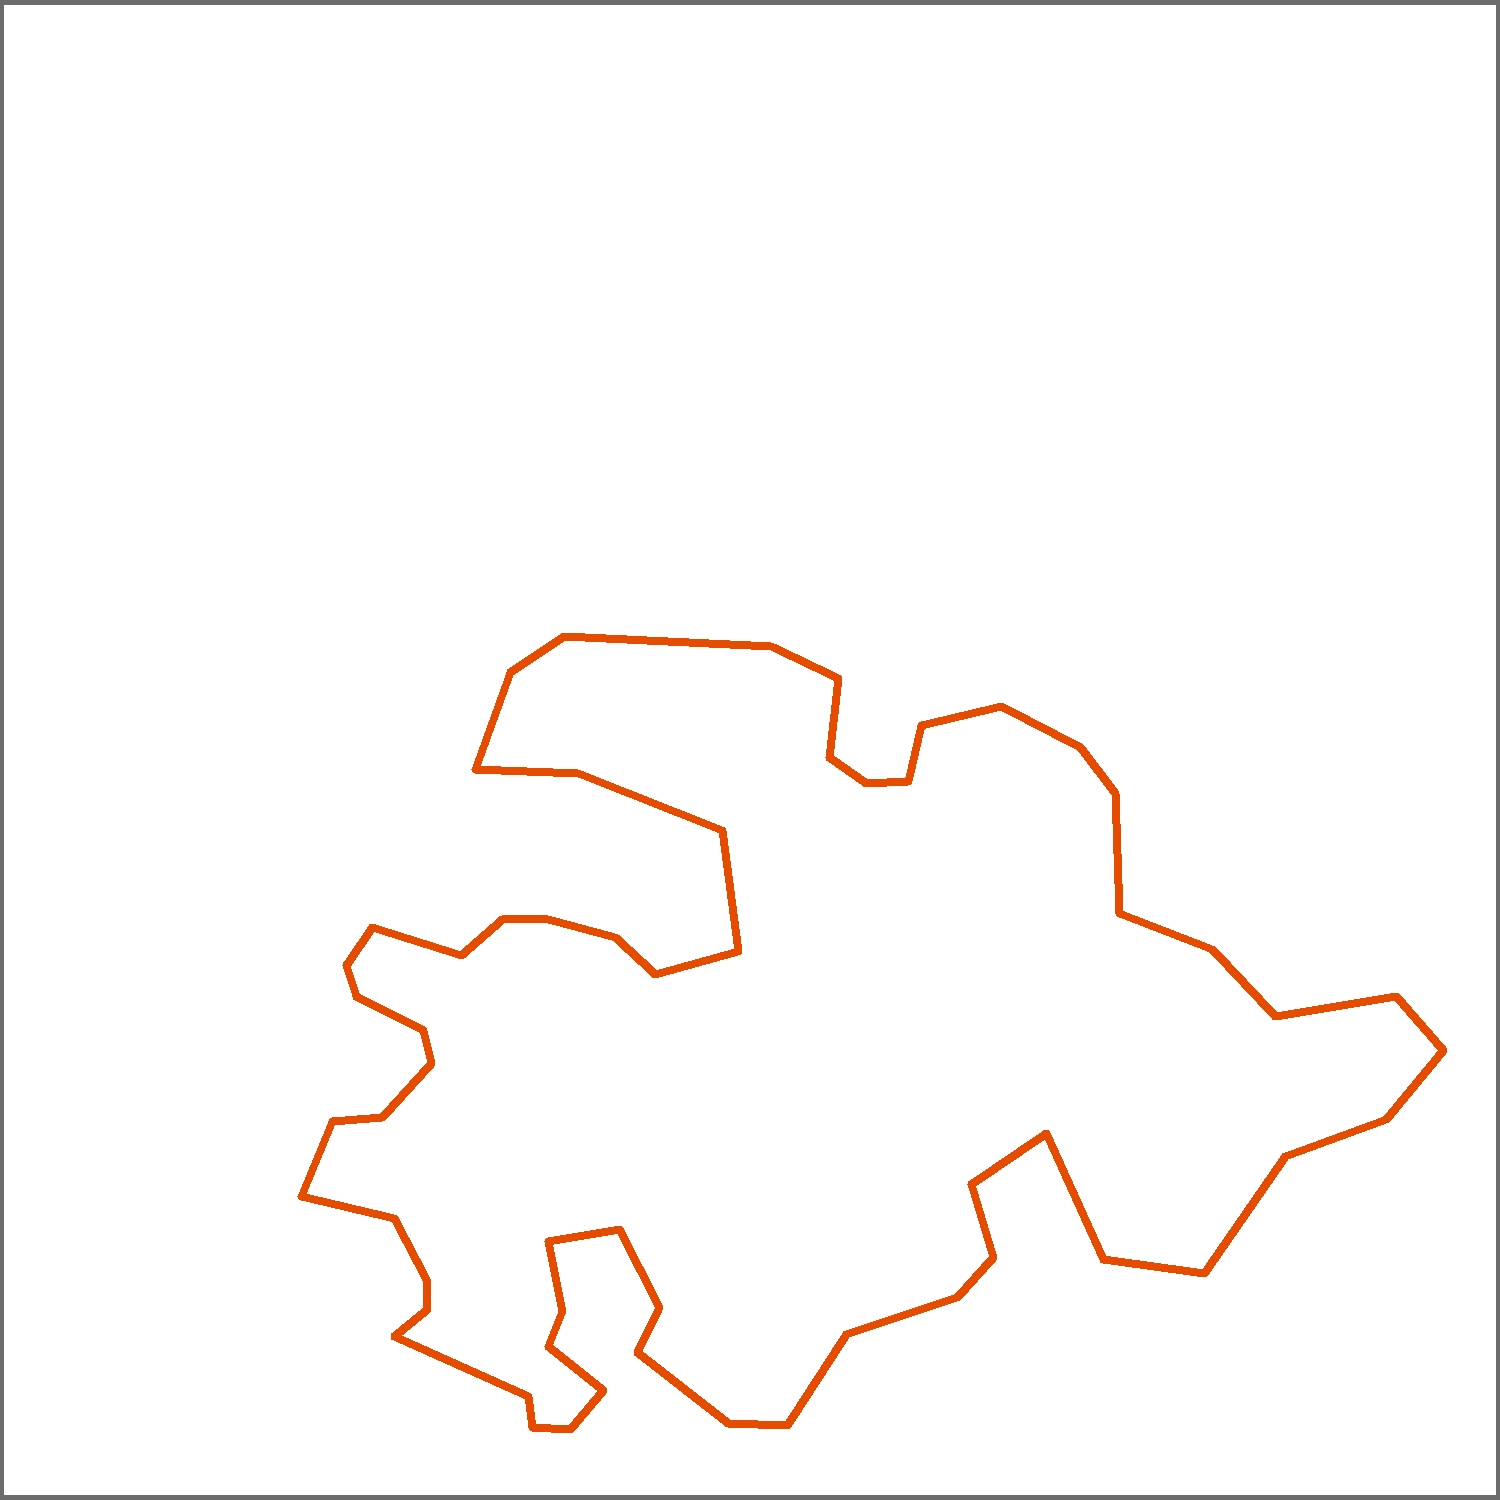
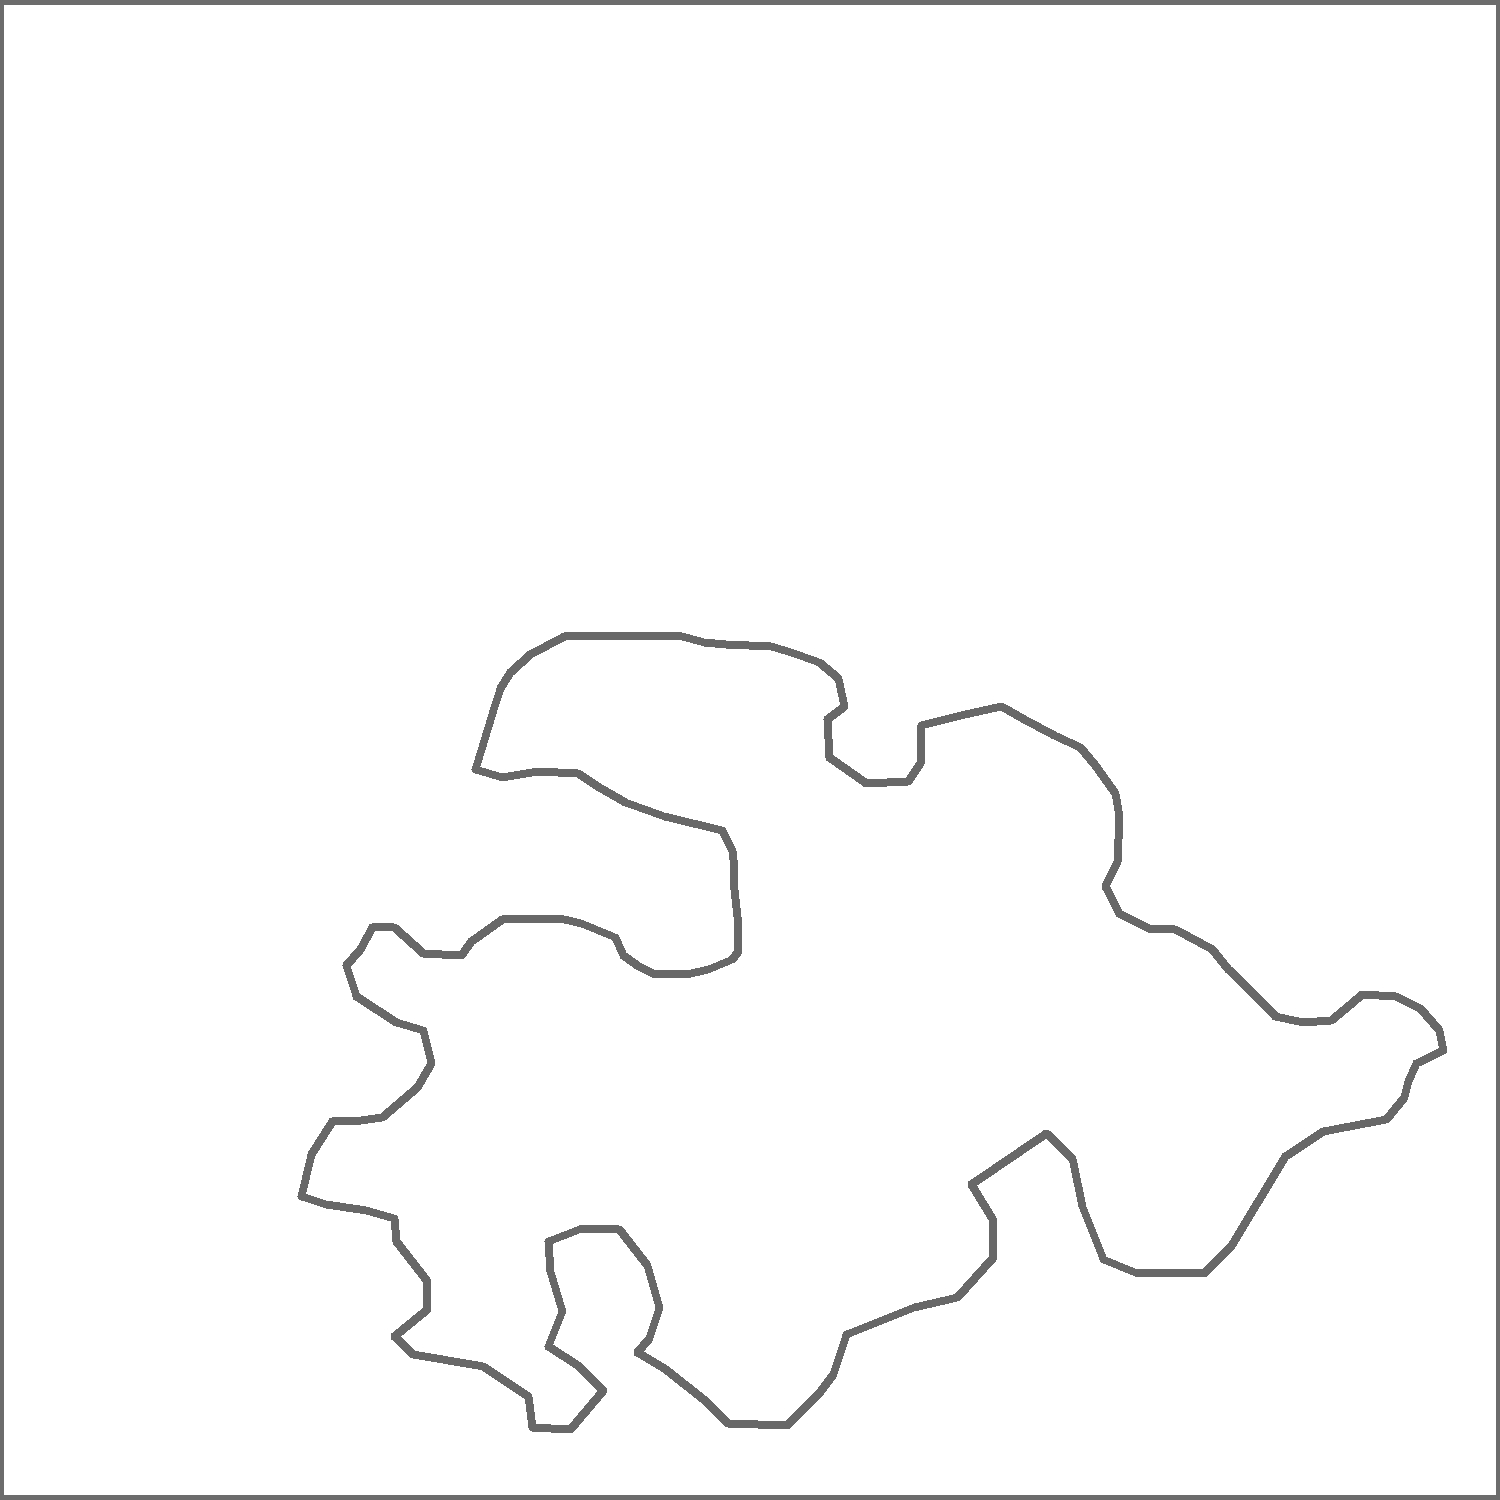
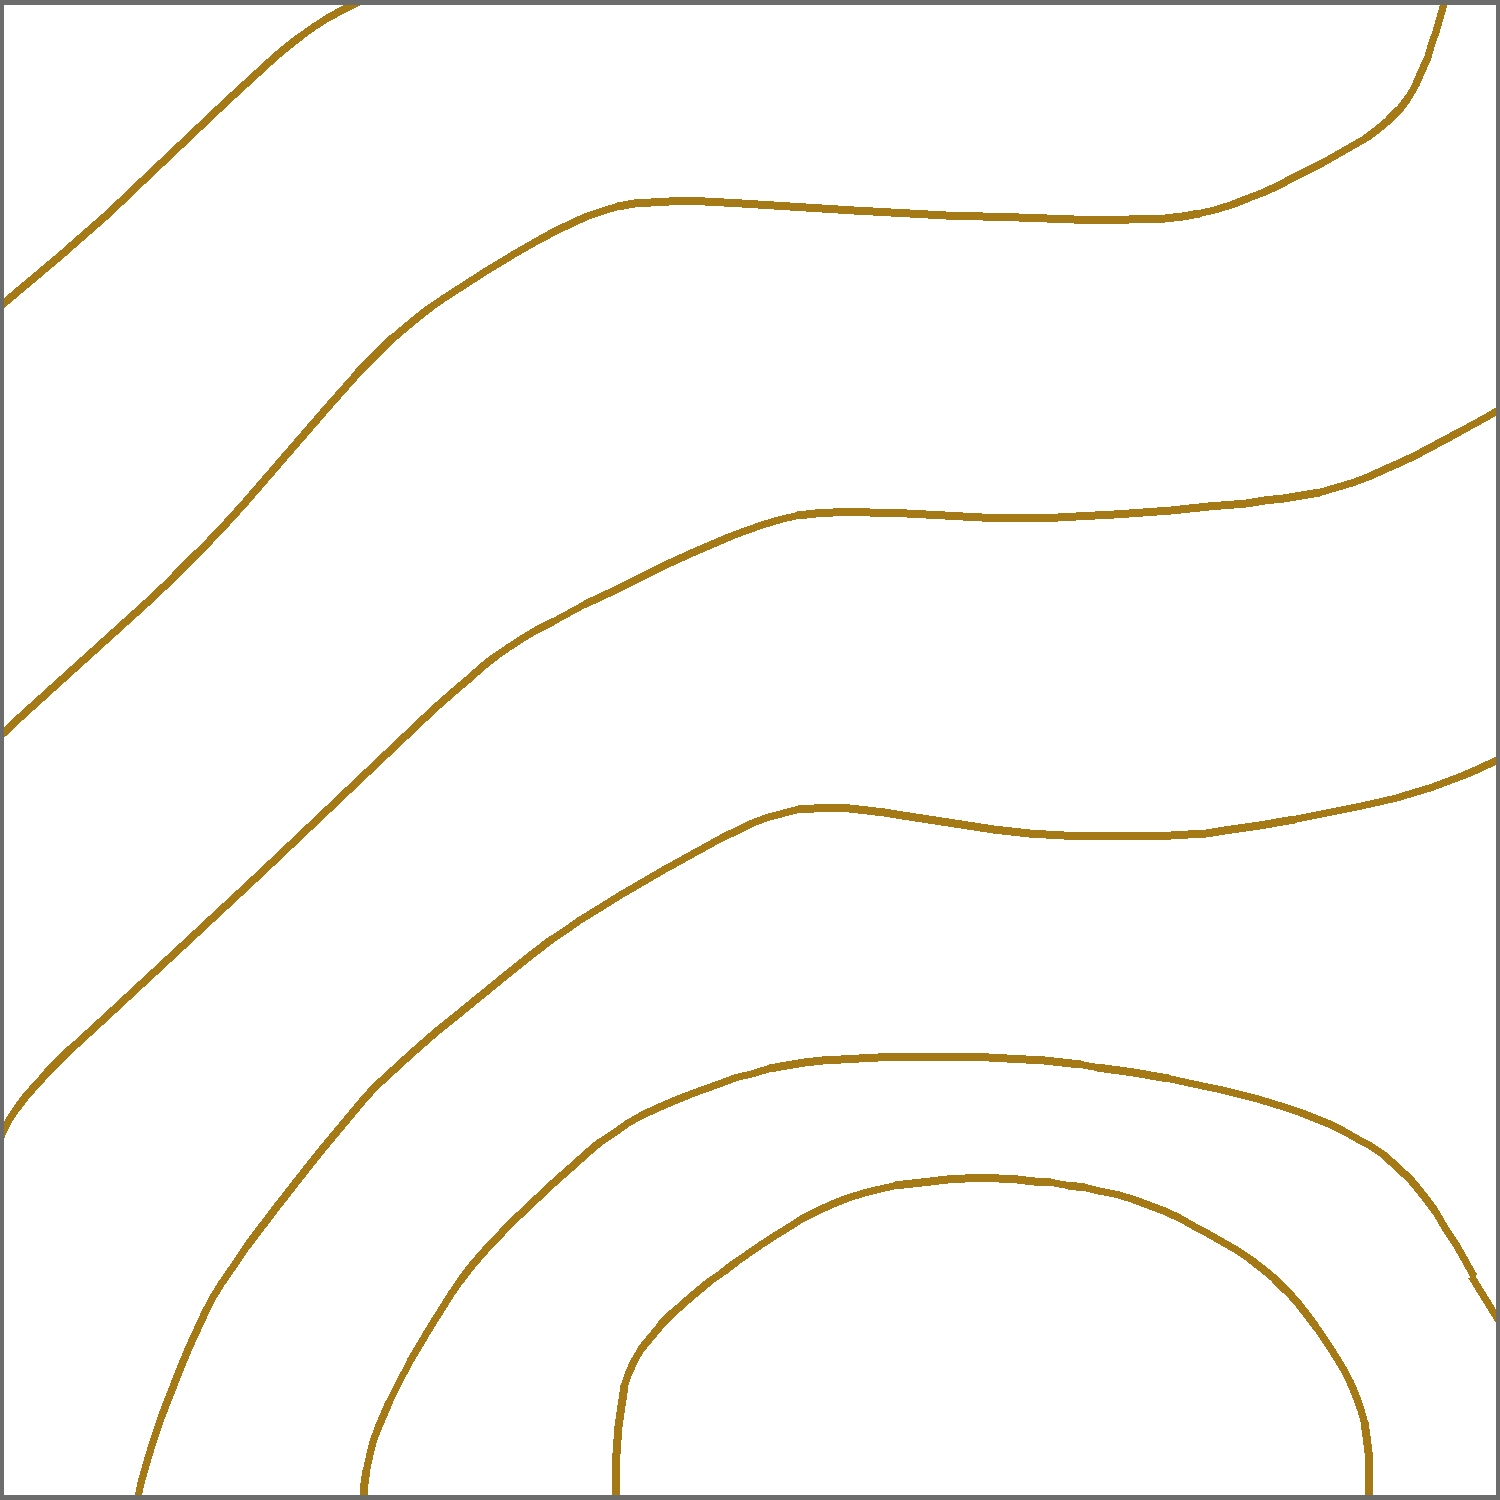
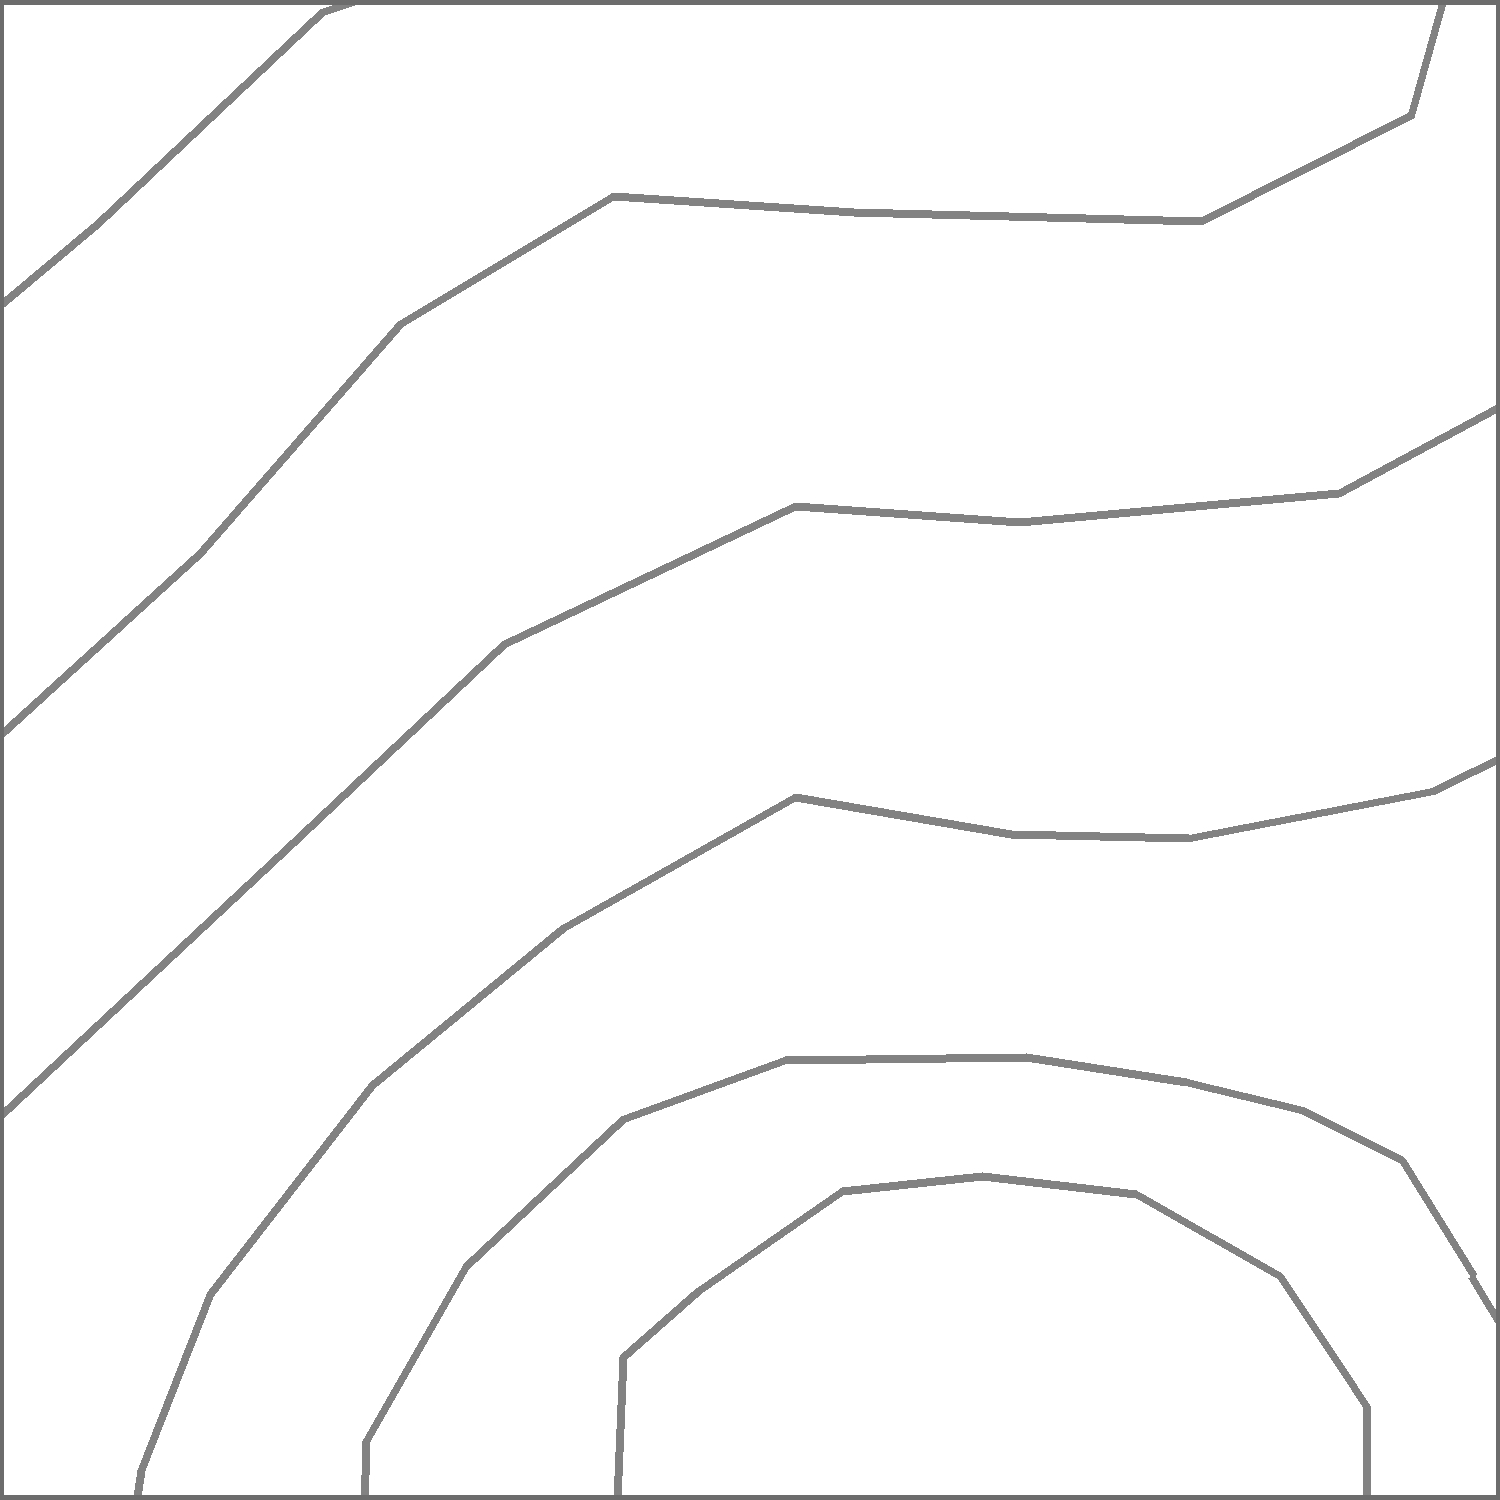
Figure 4: Hover cursor over graphic to view the results of polygon simplification and line smoothing.

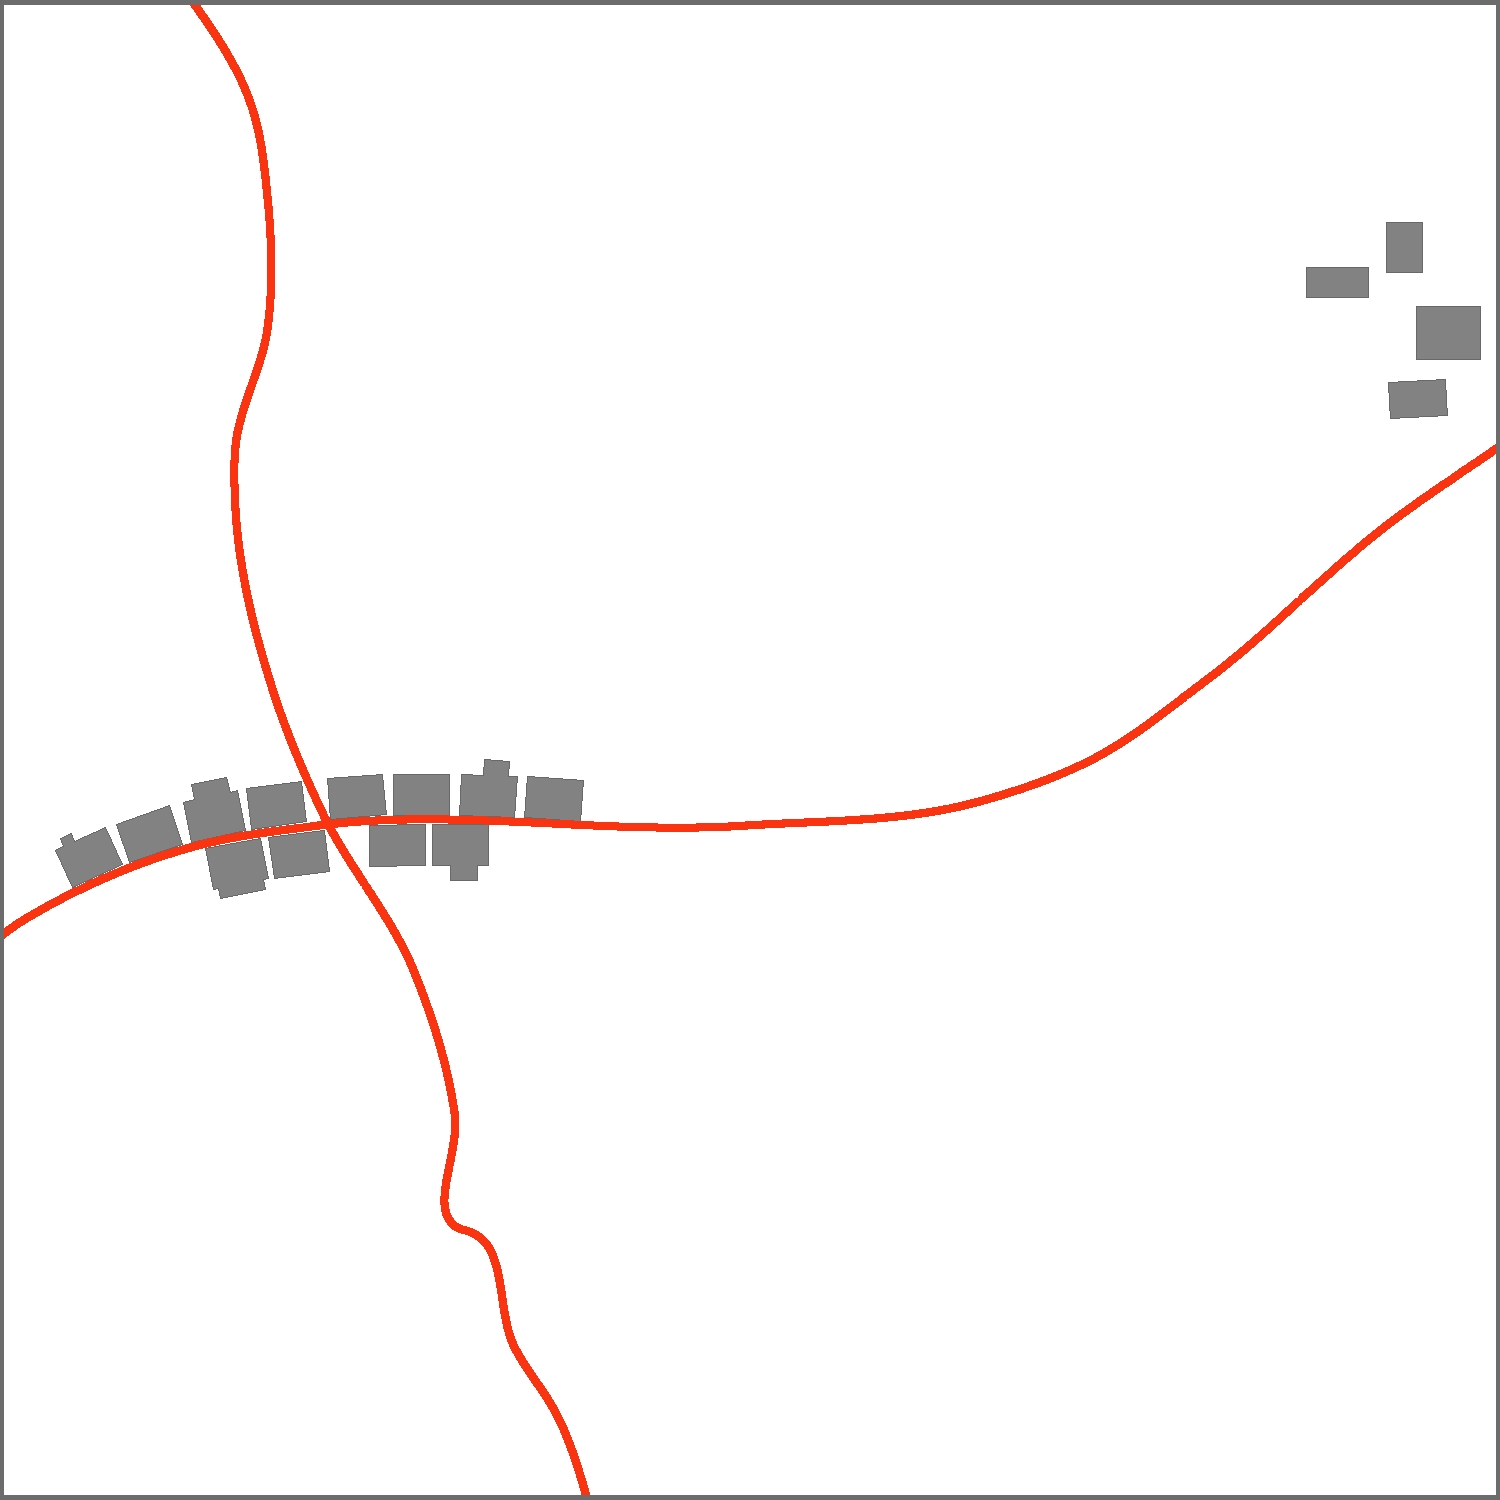
Figure 5: Hover cursor over graphic to view the results of feature displacement.
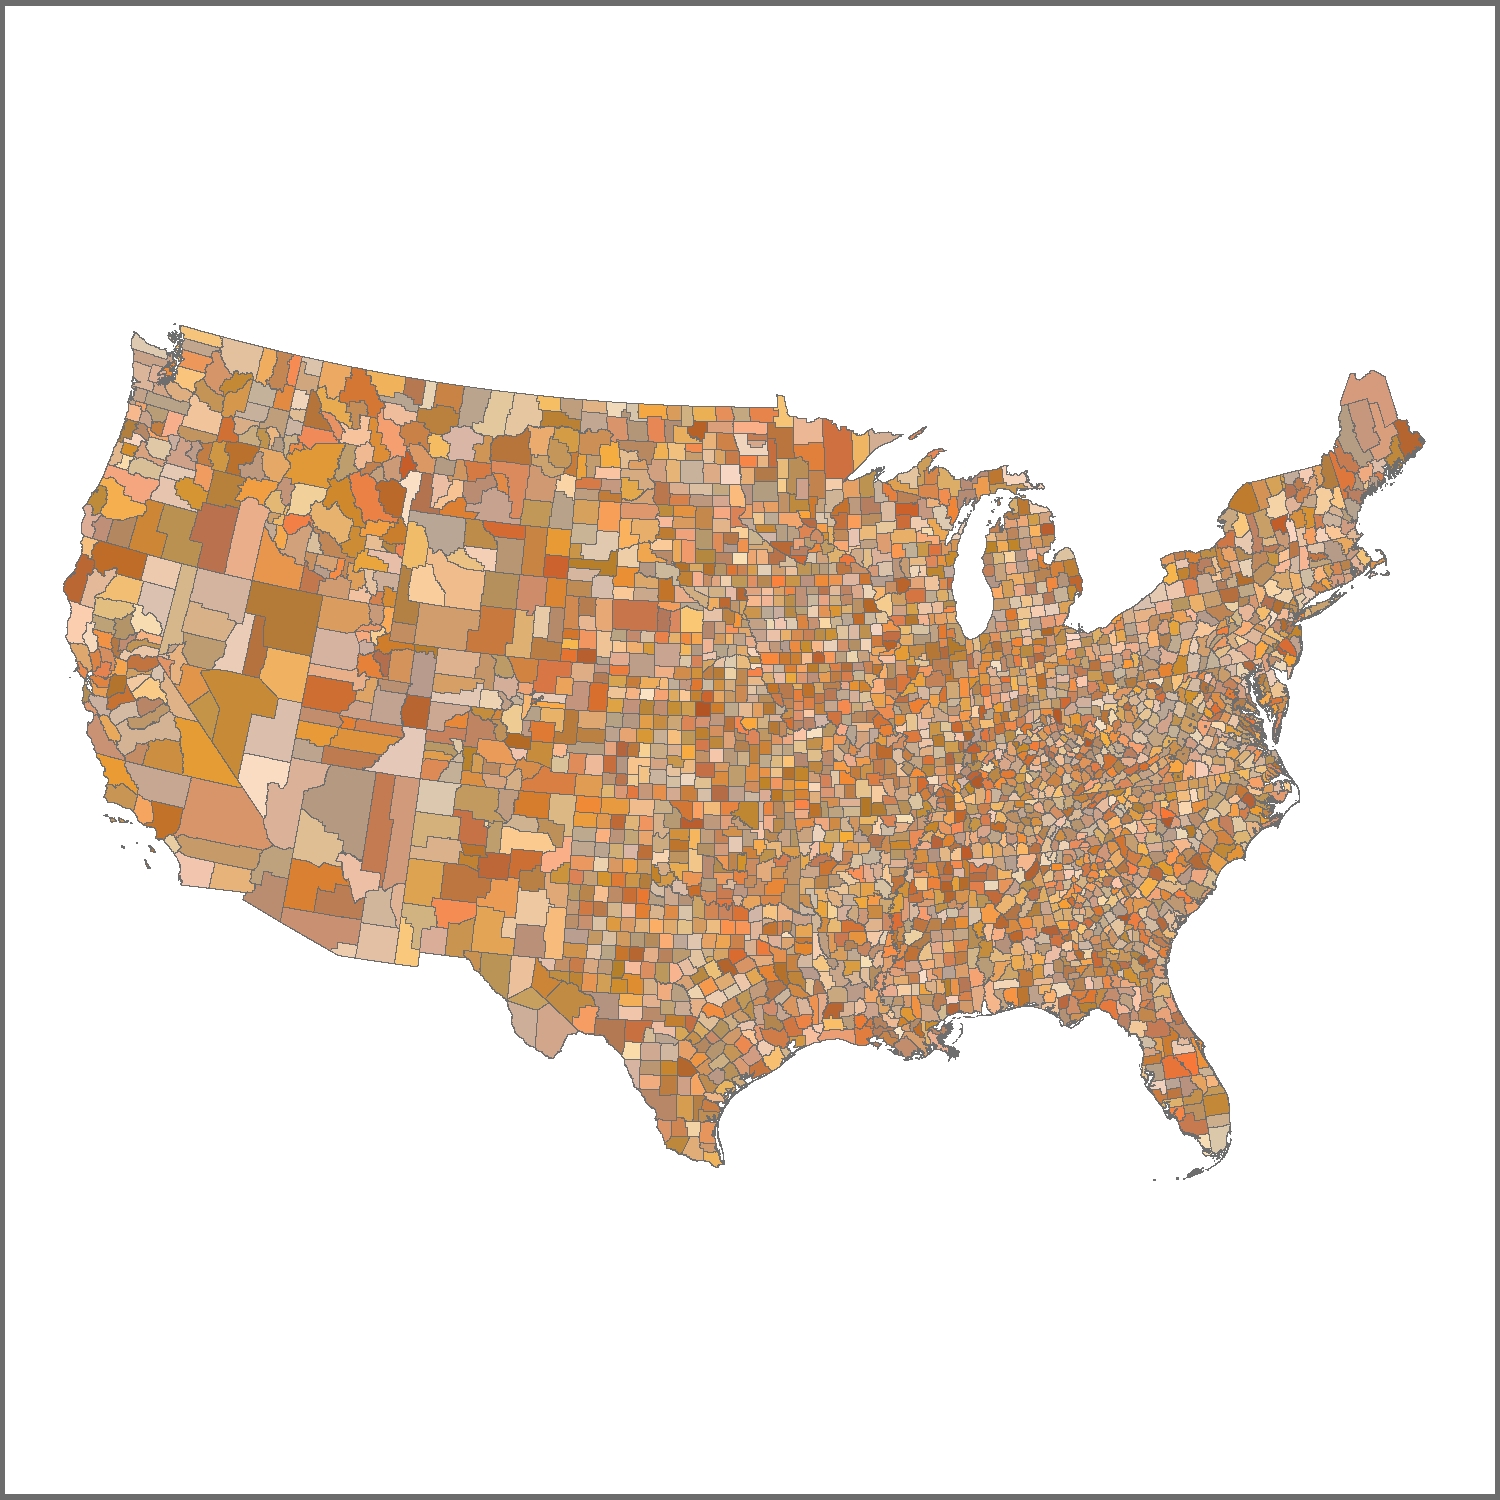
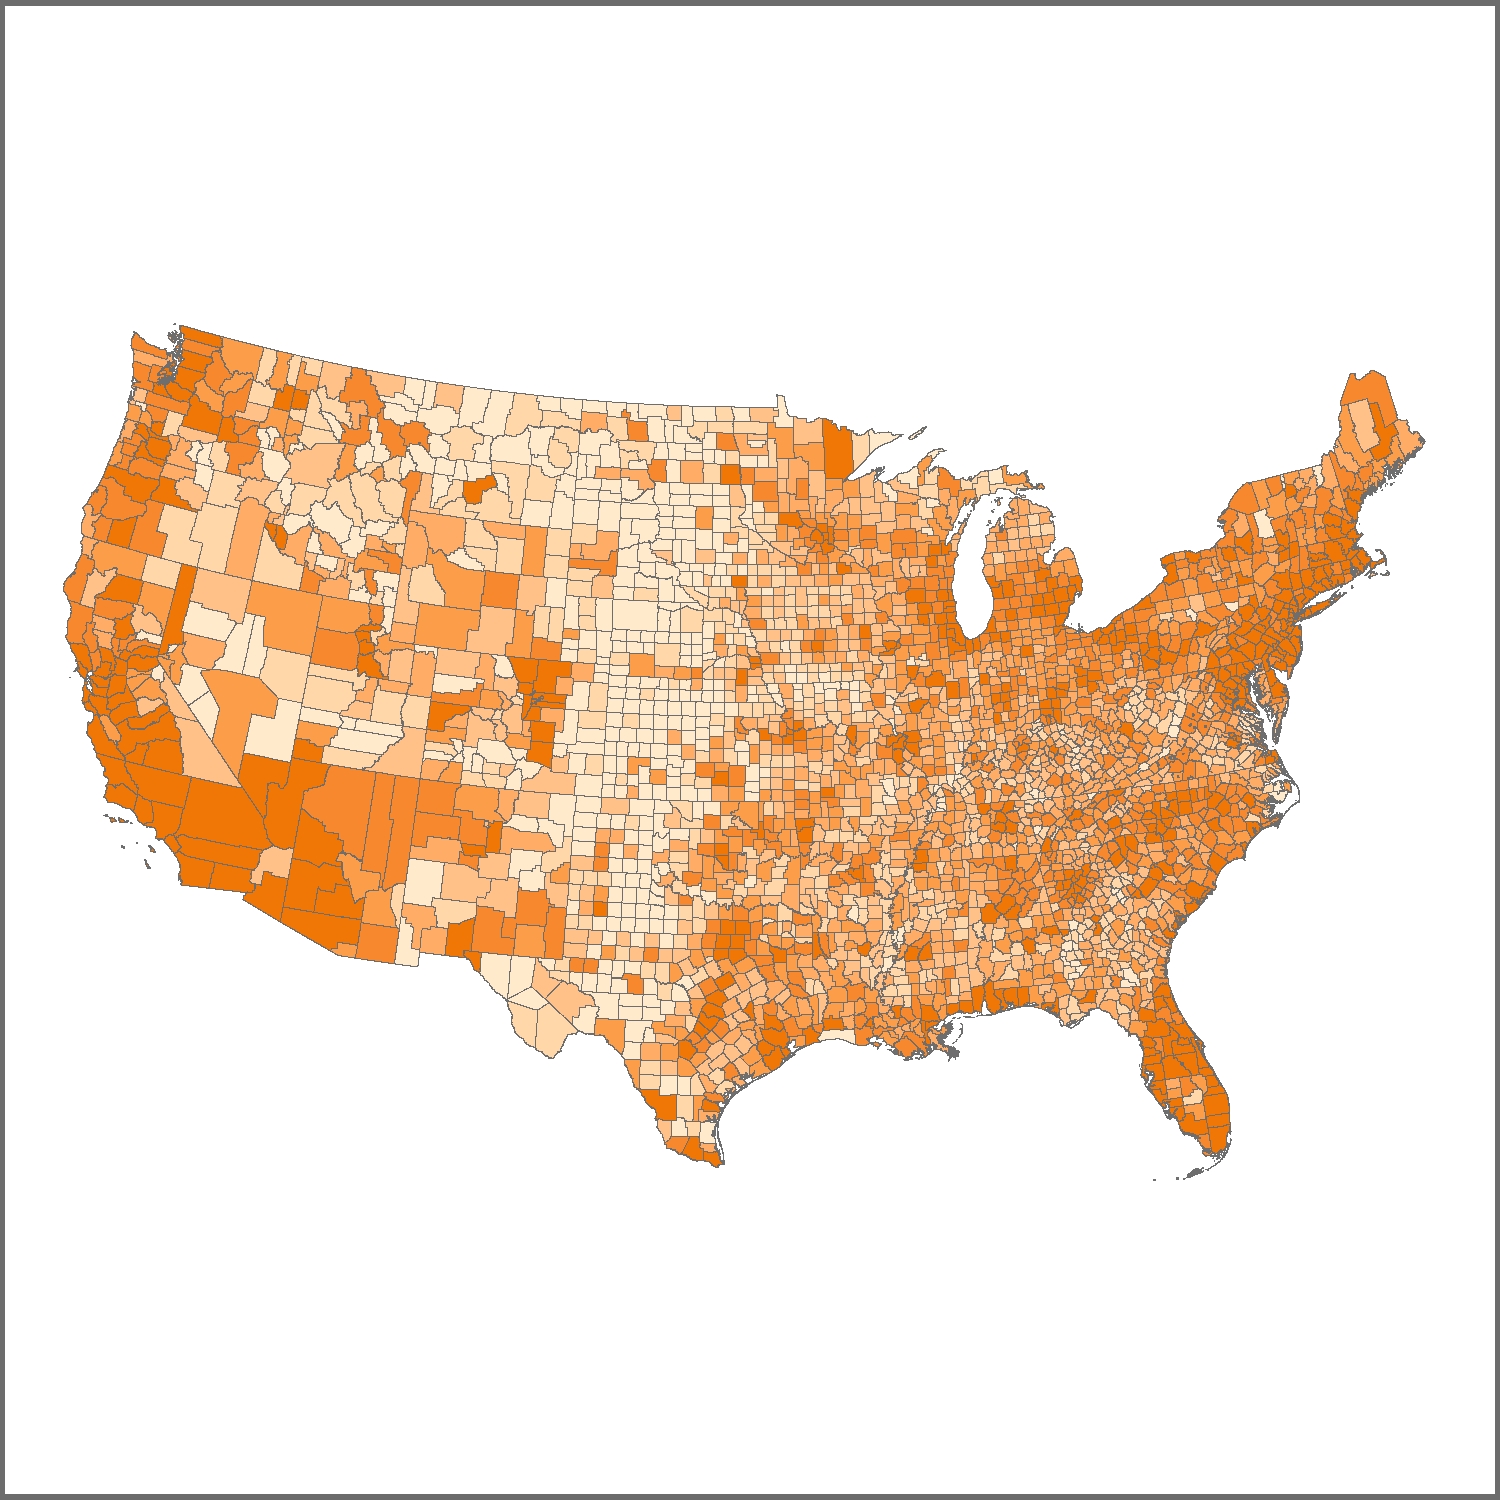
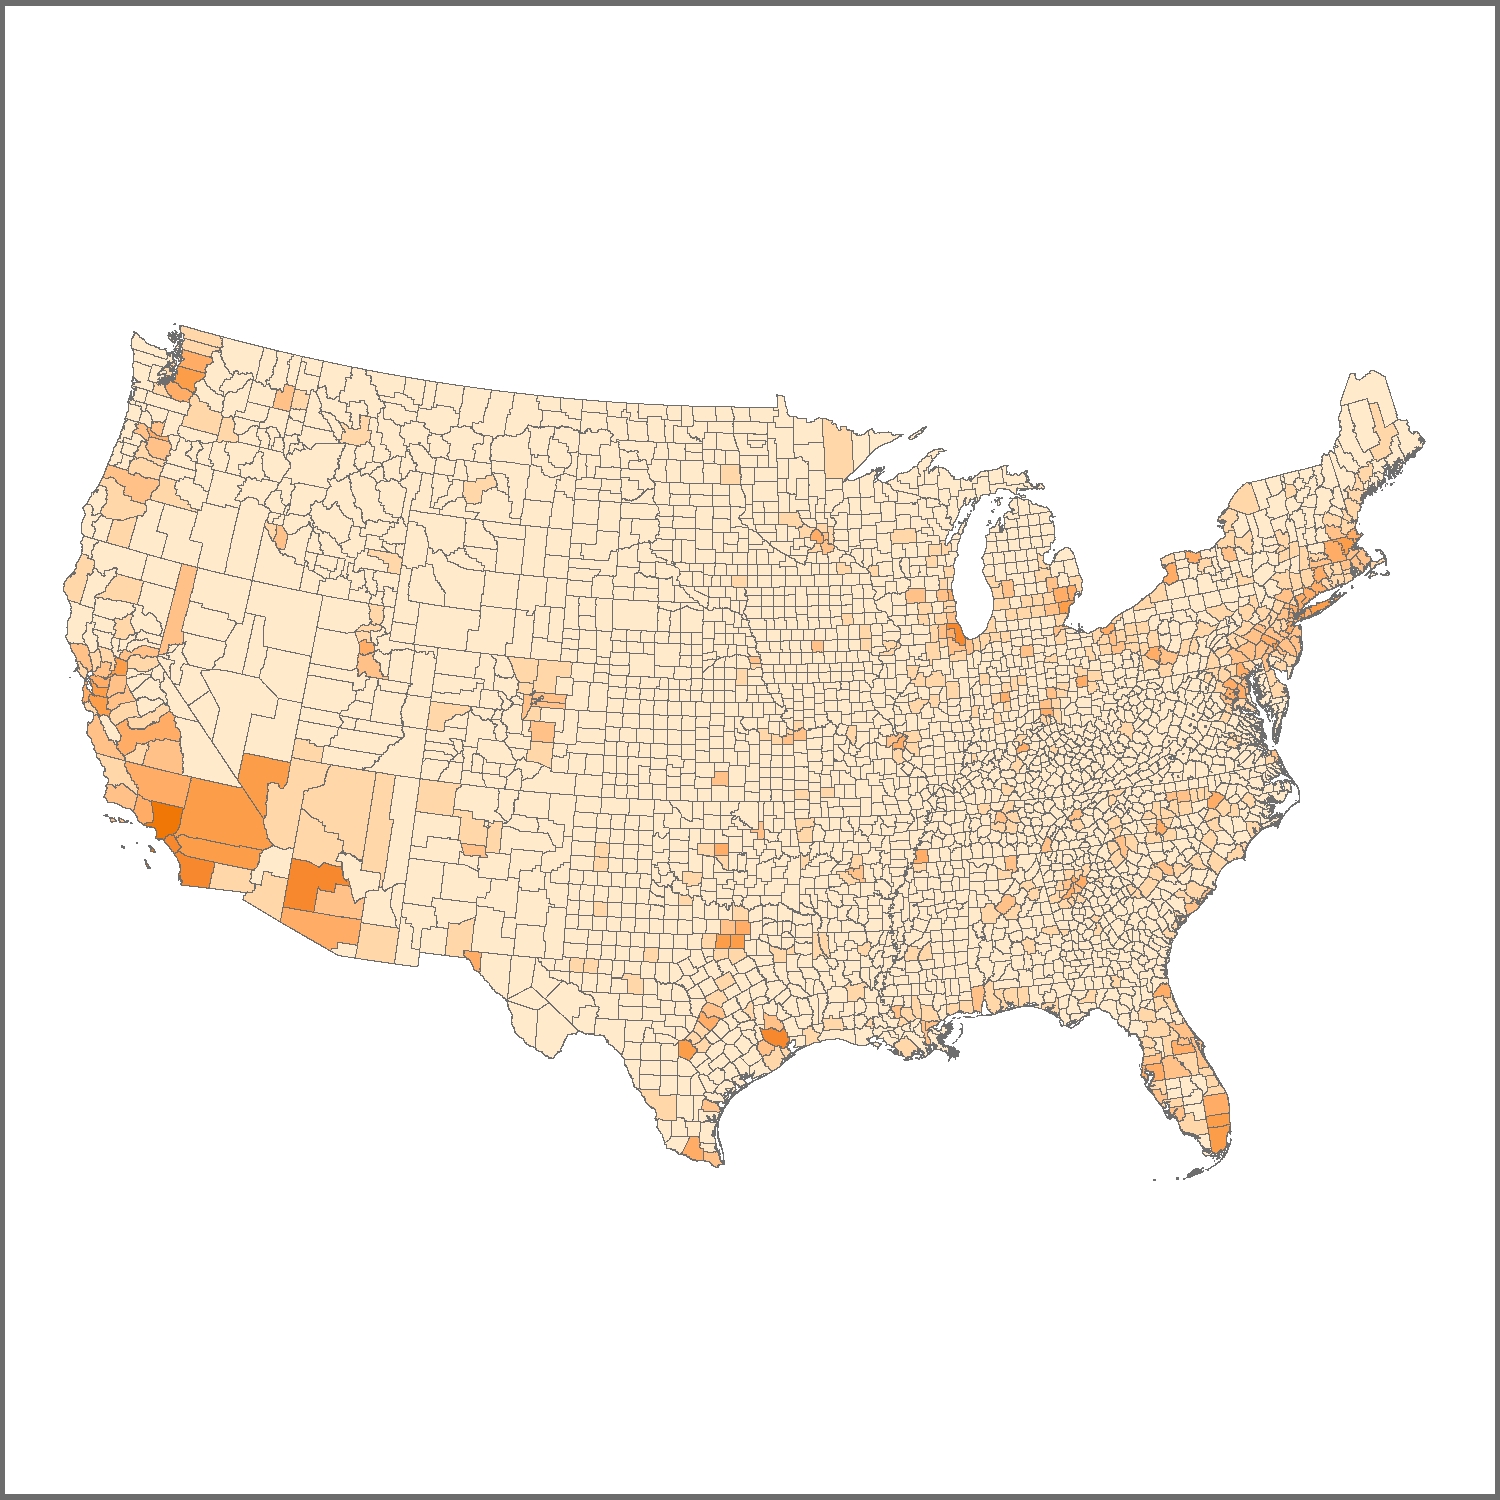
Figure 6: Hover cursor over second graphic to view the striking differences in spatial patterns based on different classification methods applied to data in first graphic.
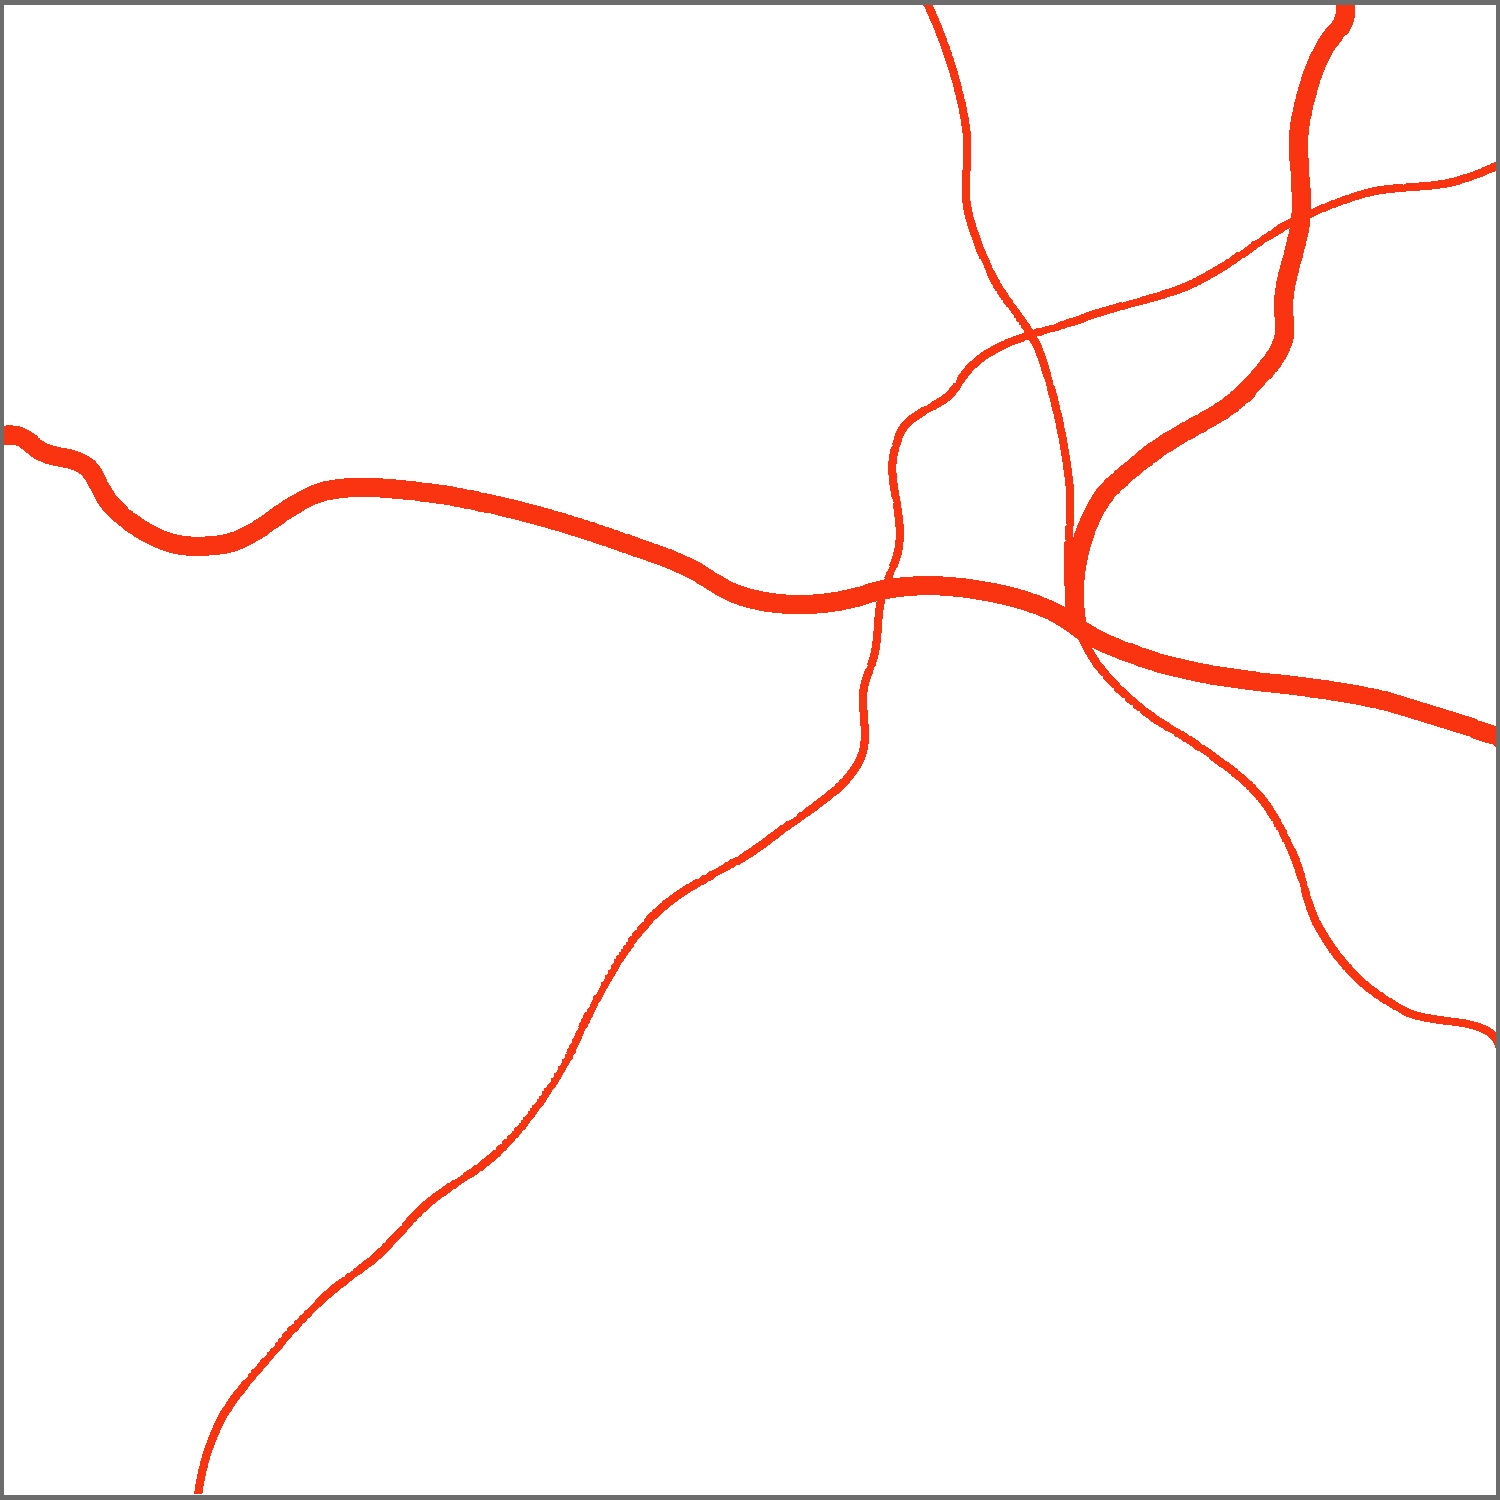
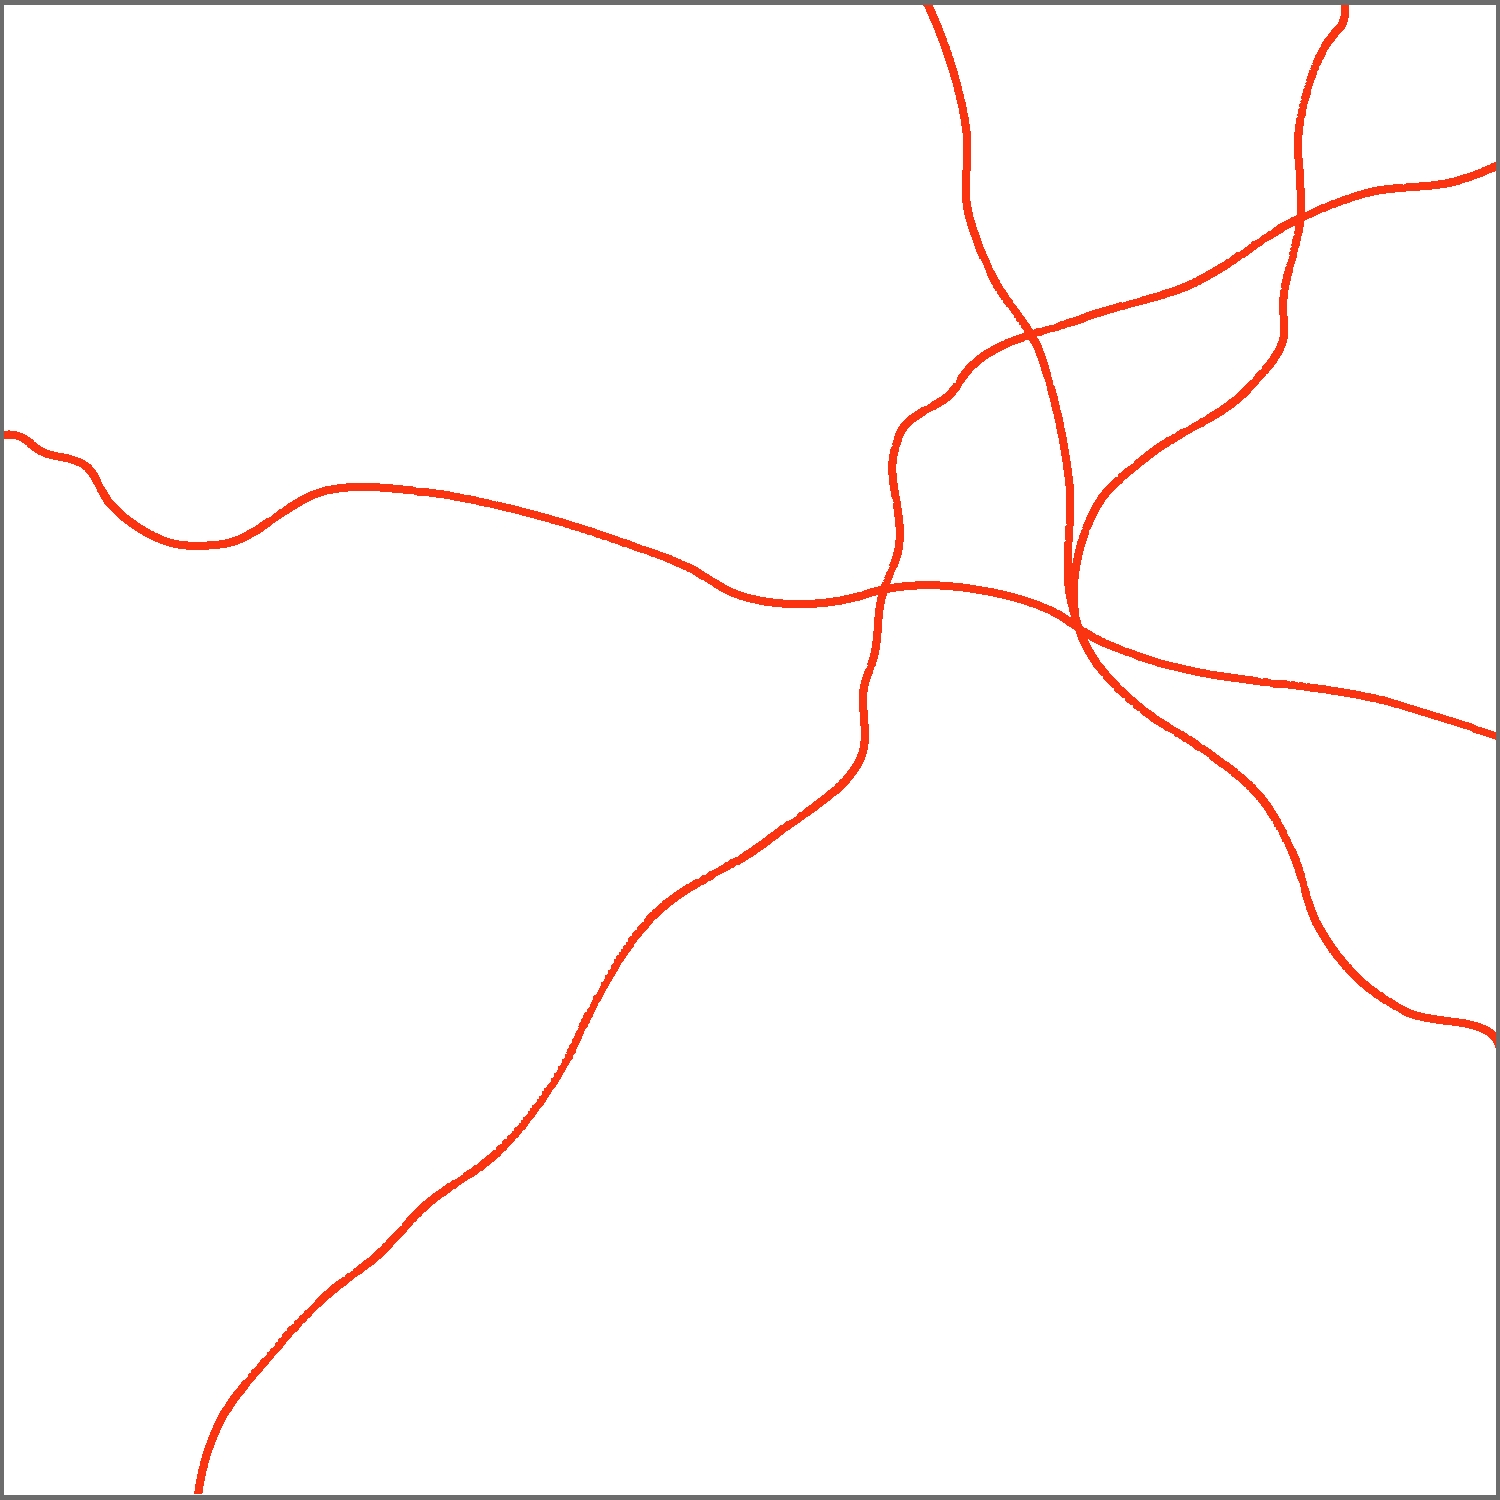

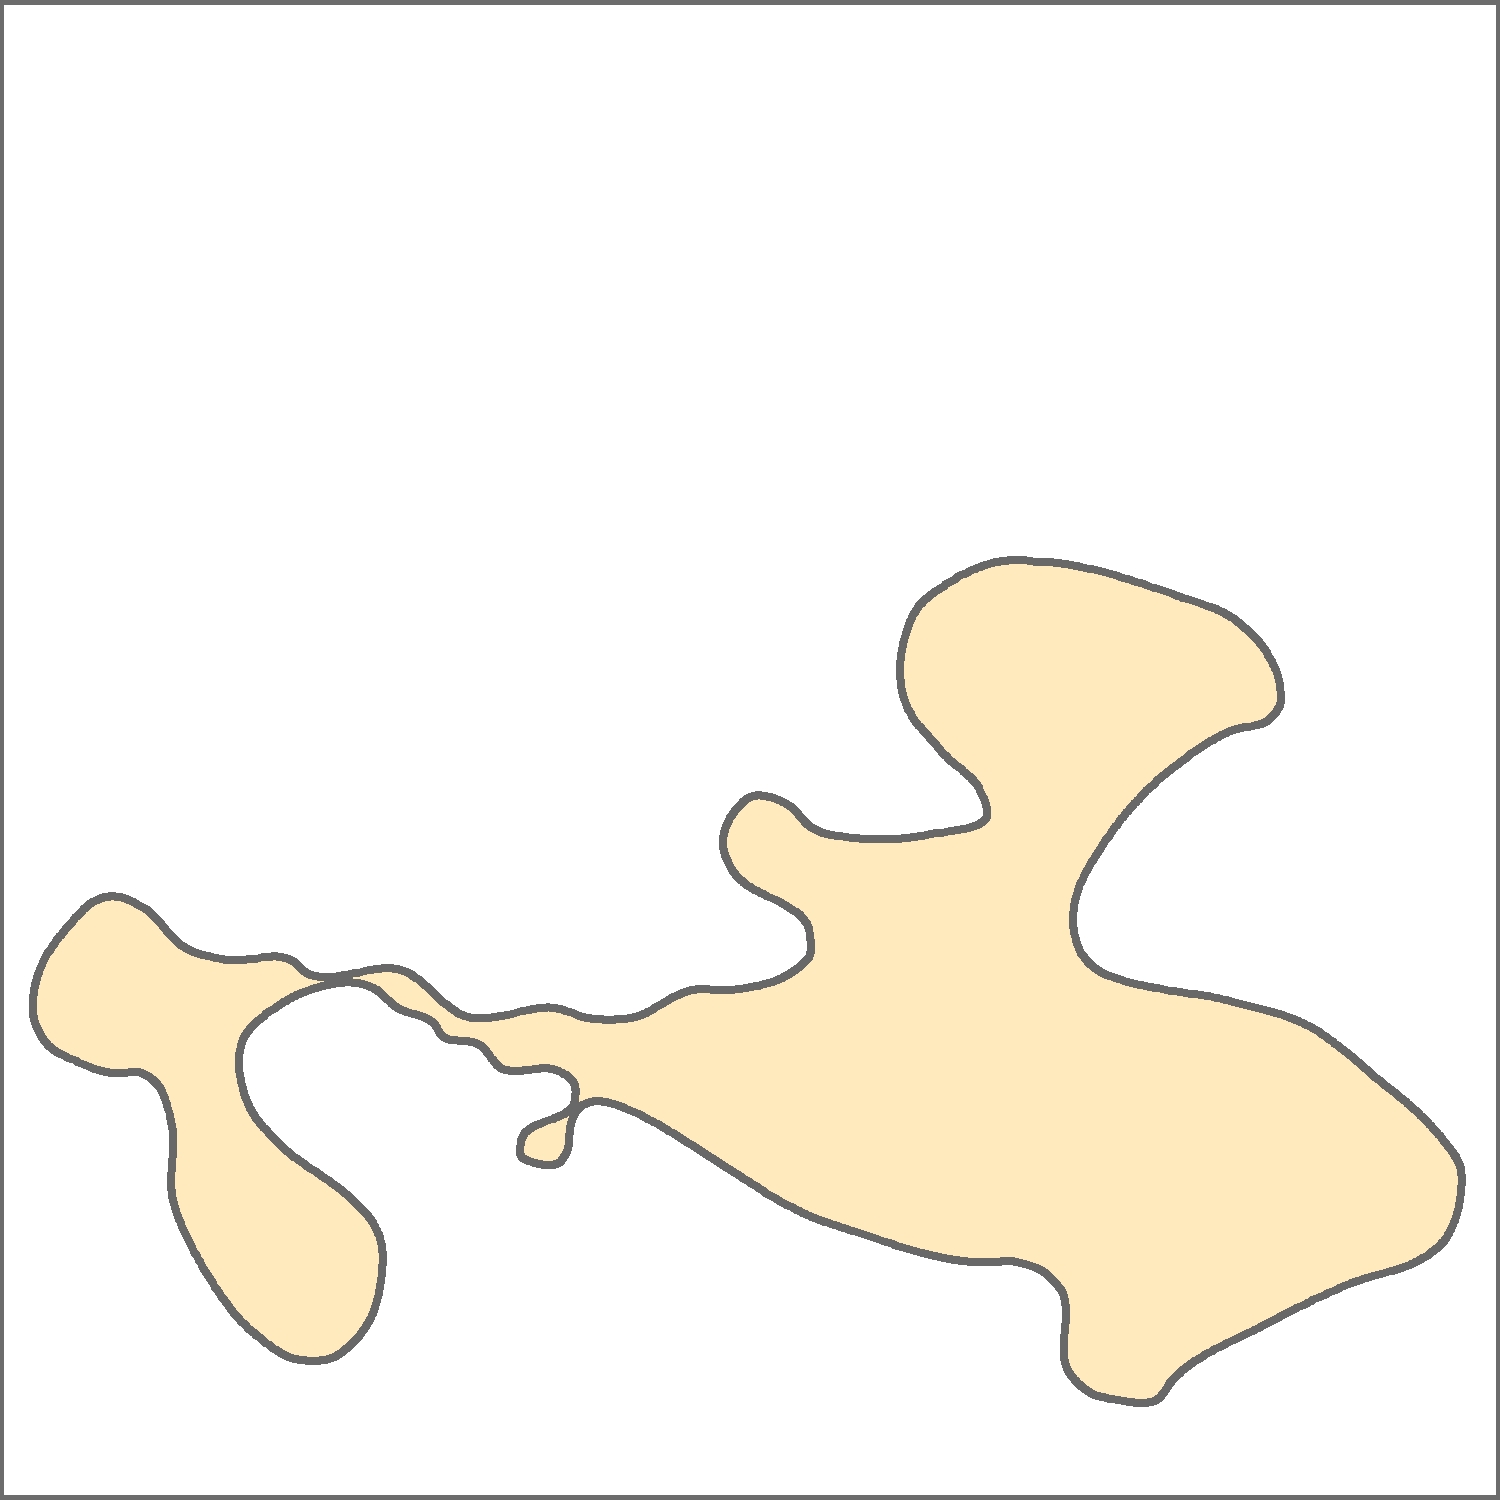
Figure 7: Hover cursor over graphic to view the results of enhancing and exaggerating line and polygon features.
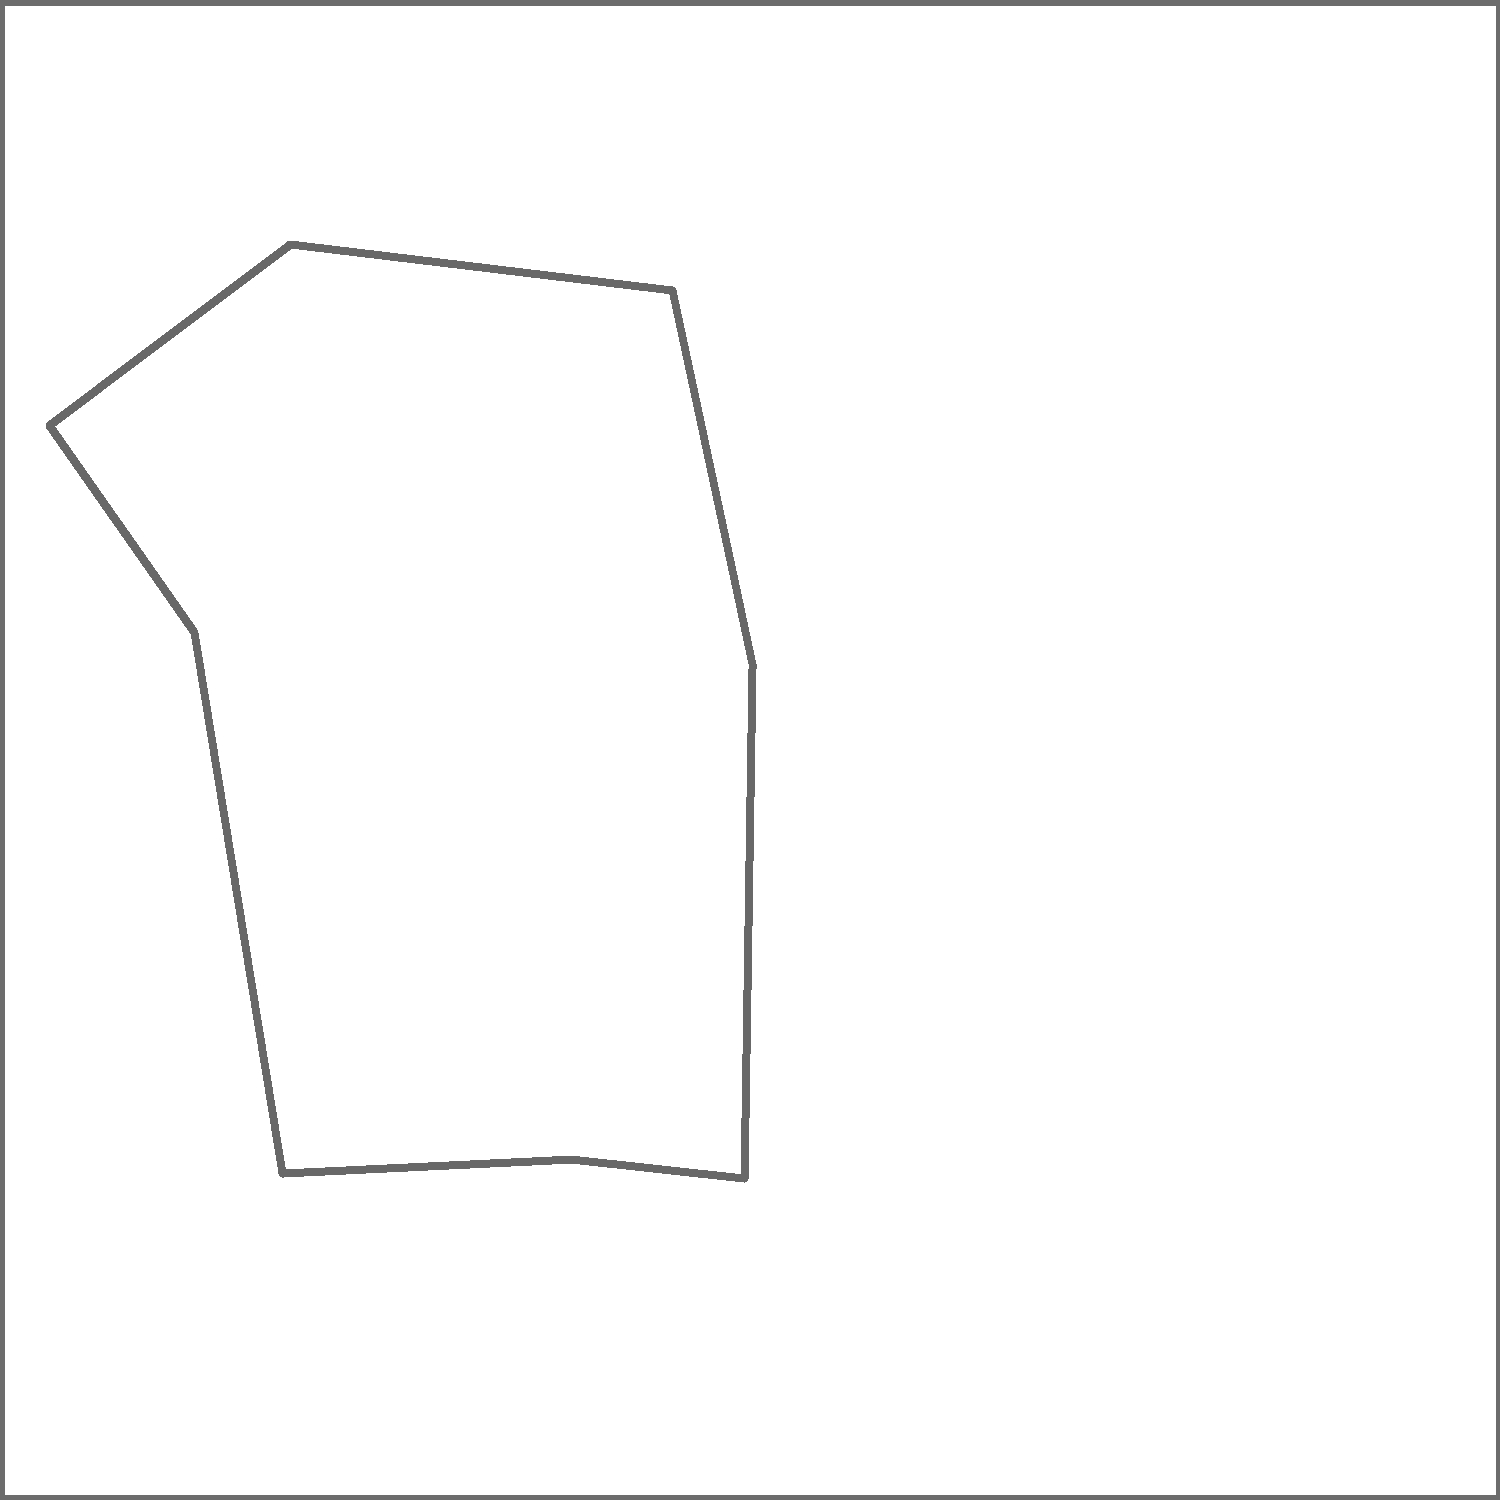
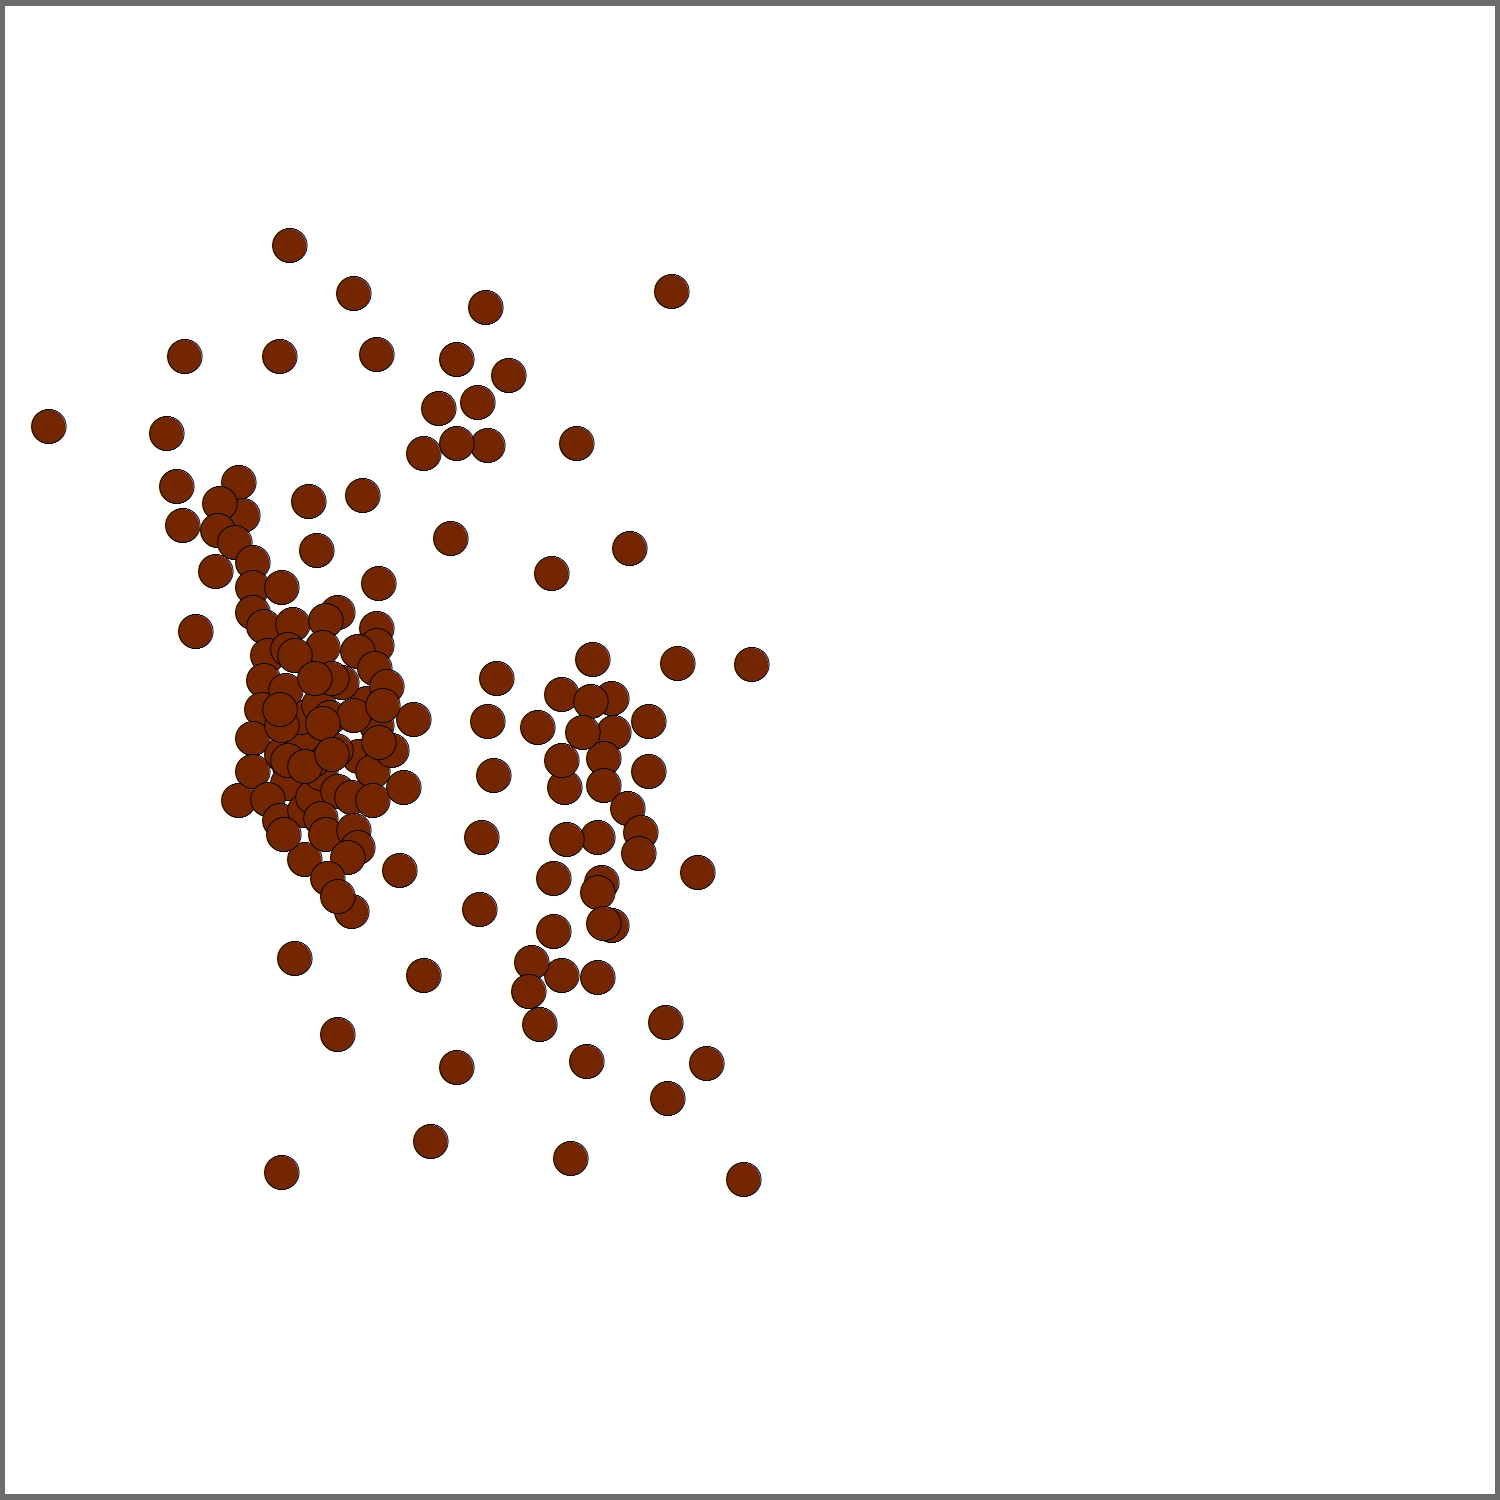
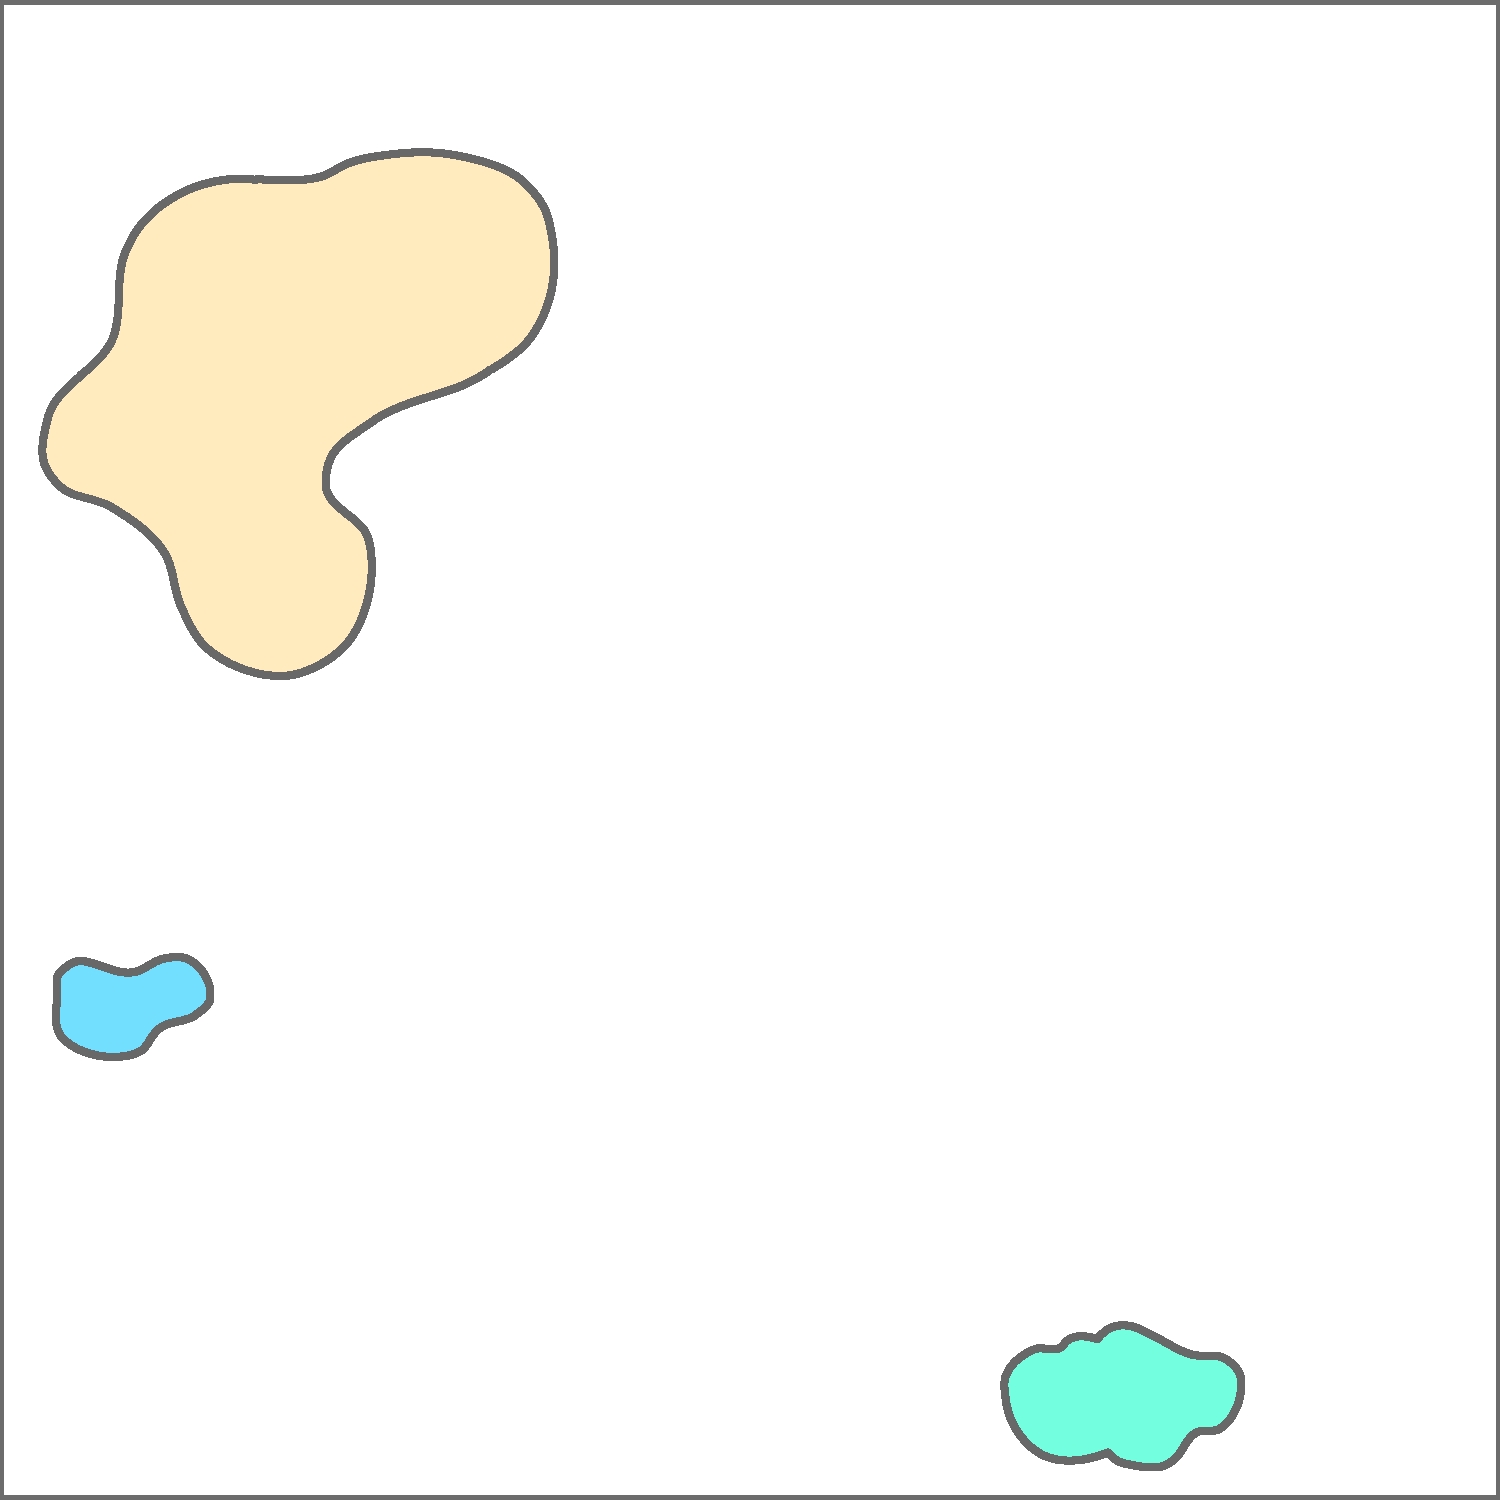
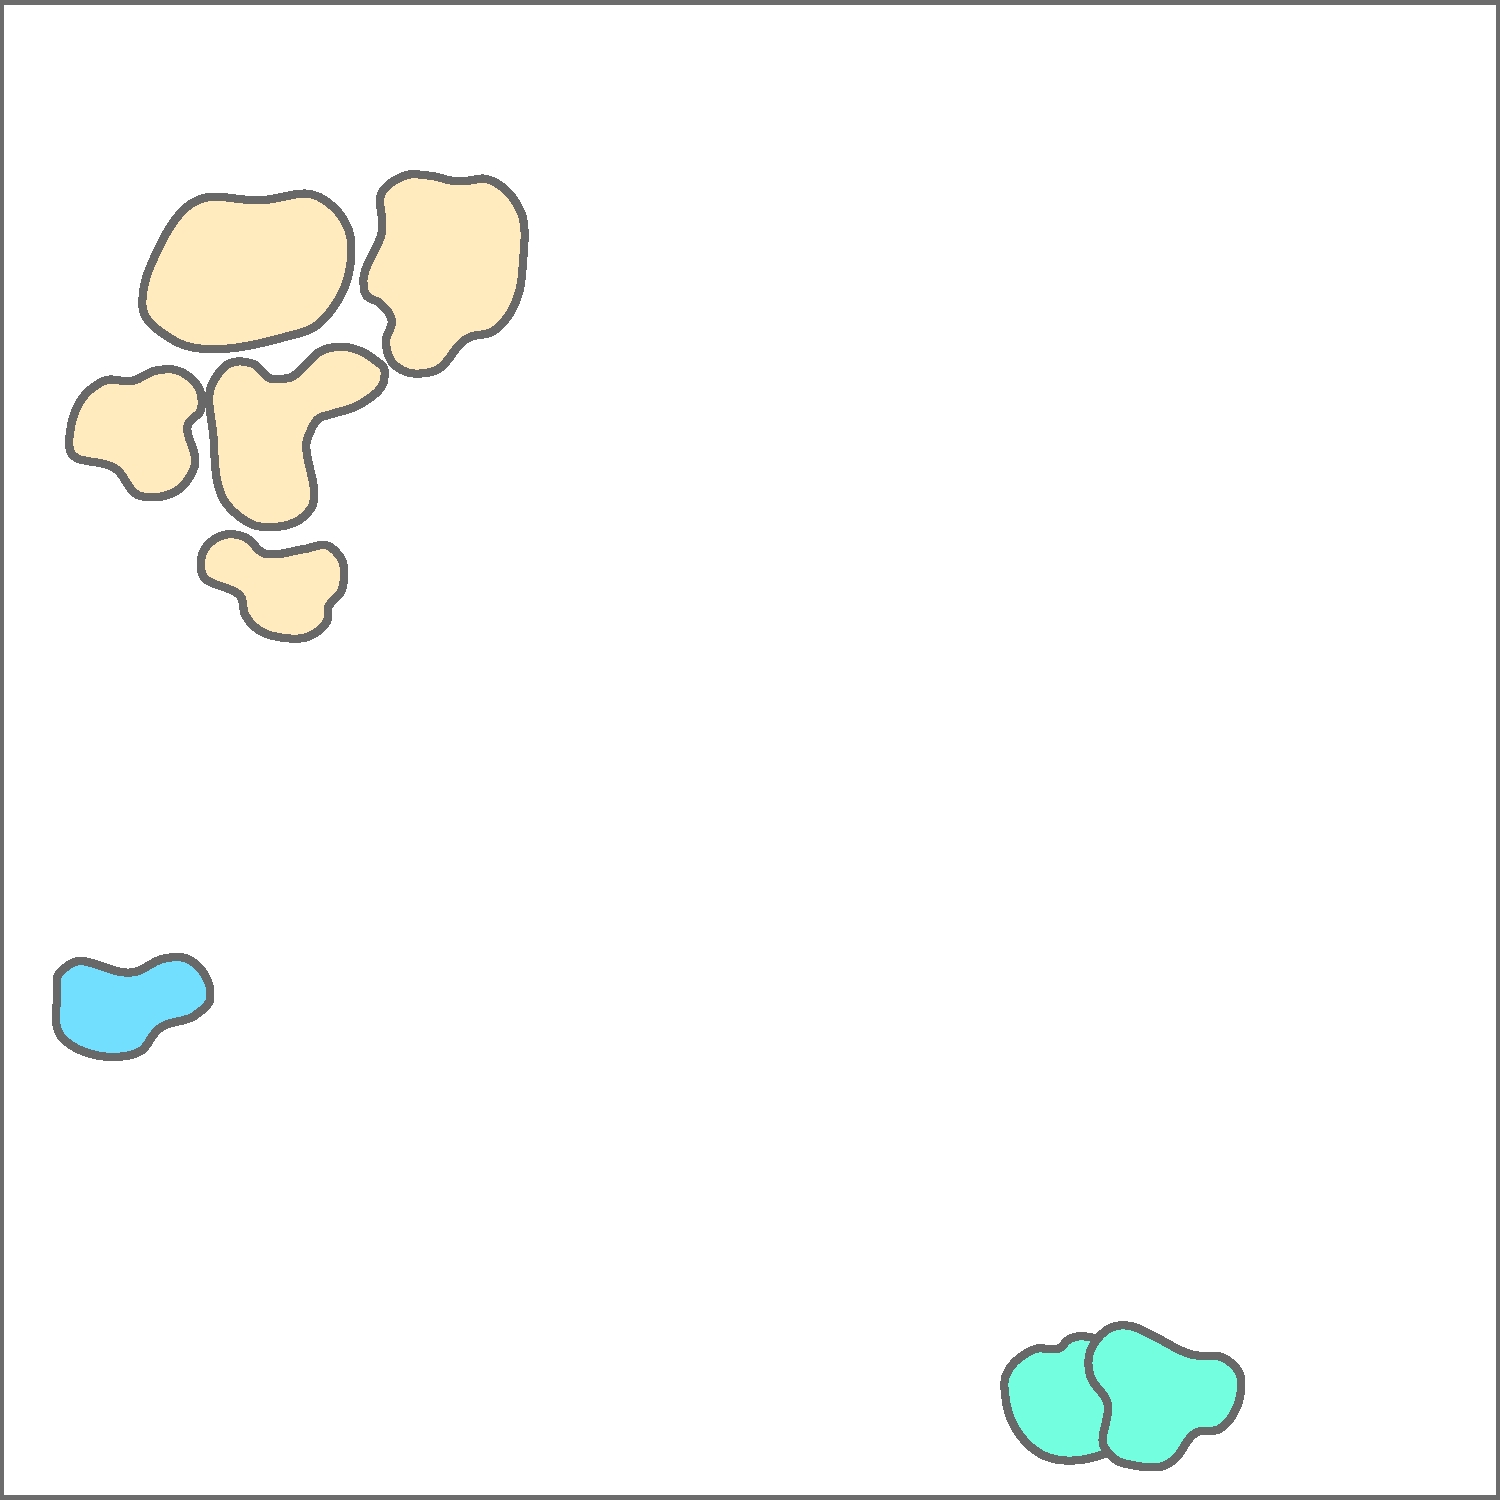
Figure 8: Hover cursor over graphic to view the results of aggregating point and polygon features.
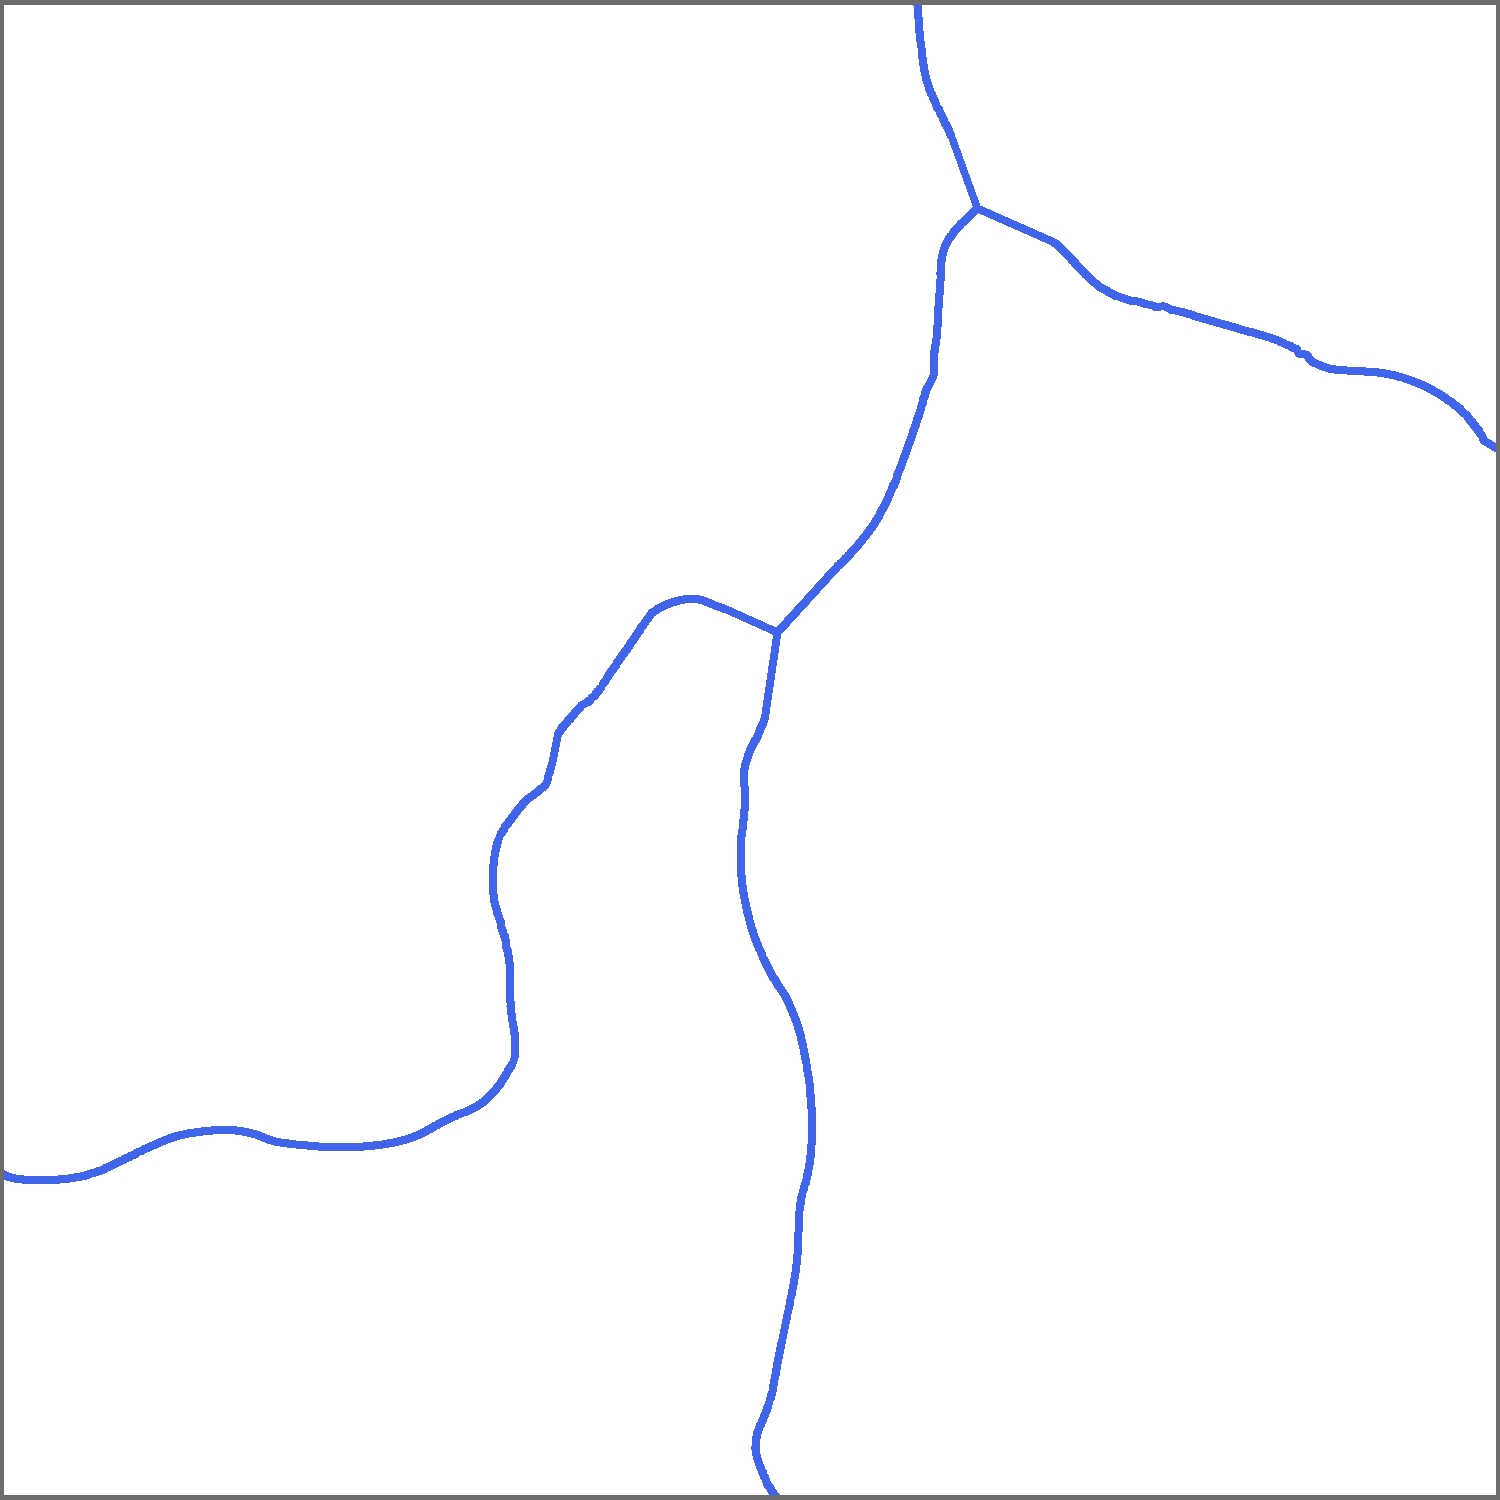
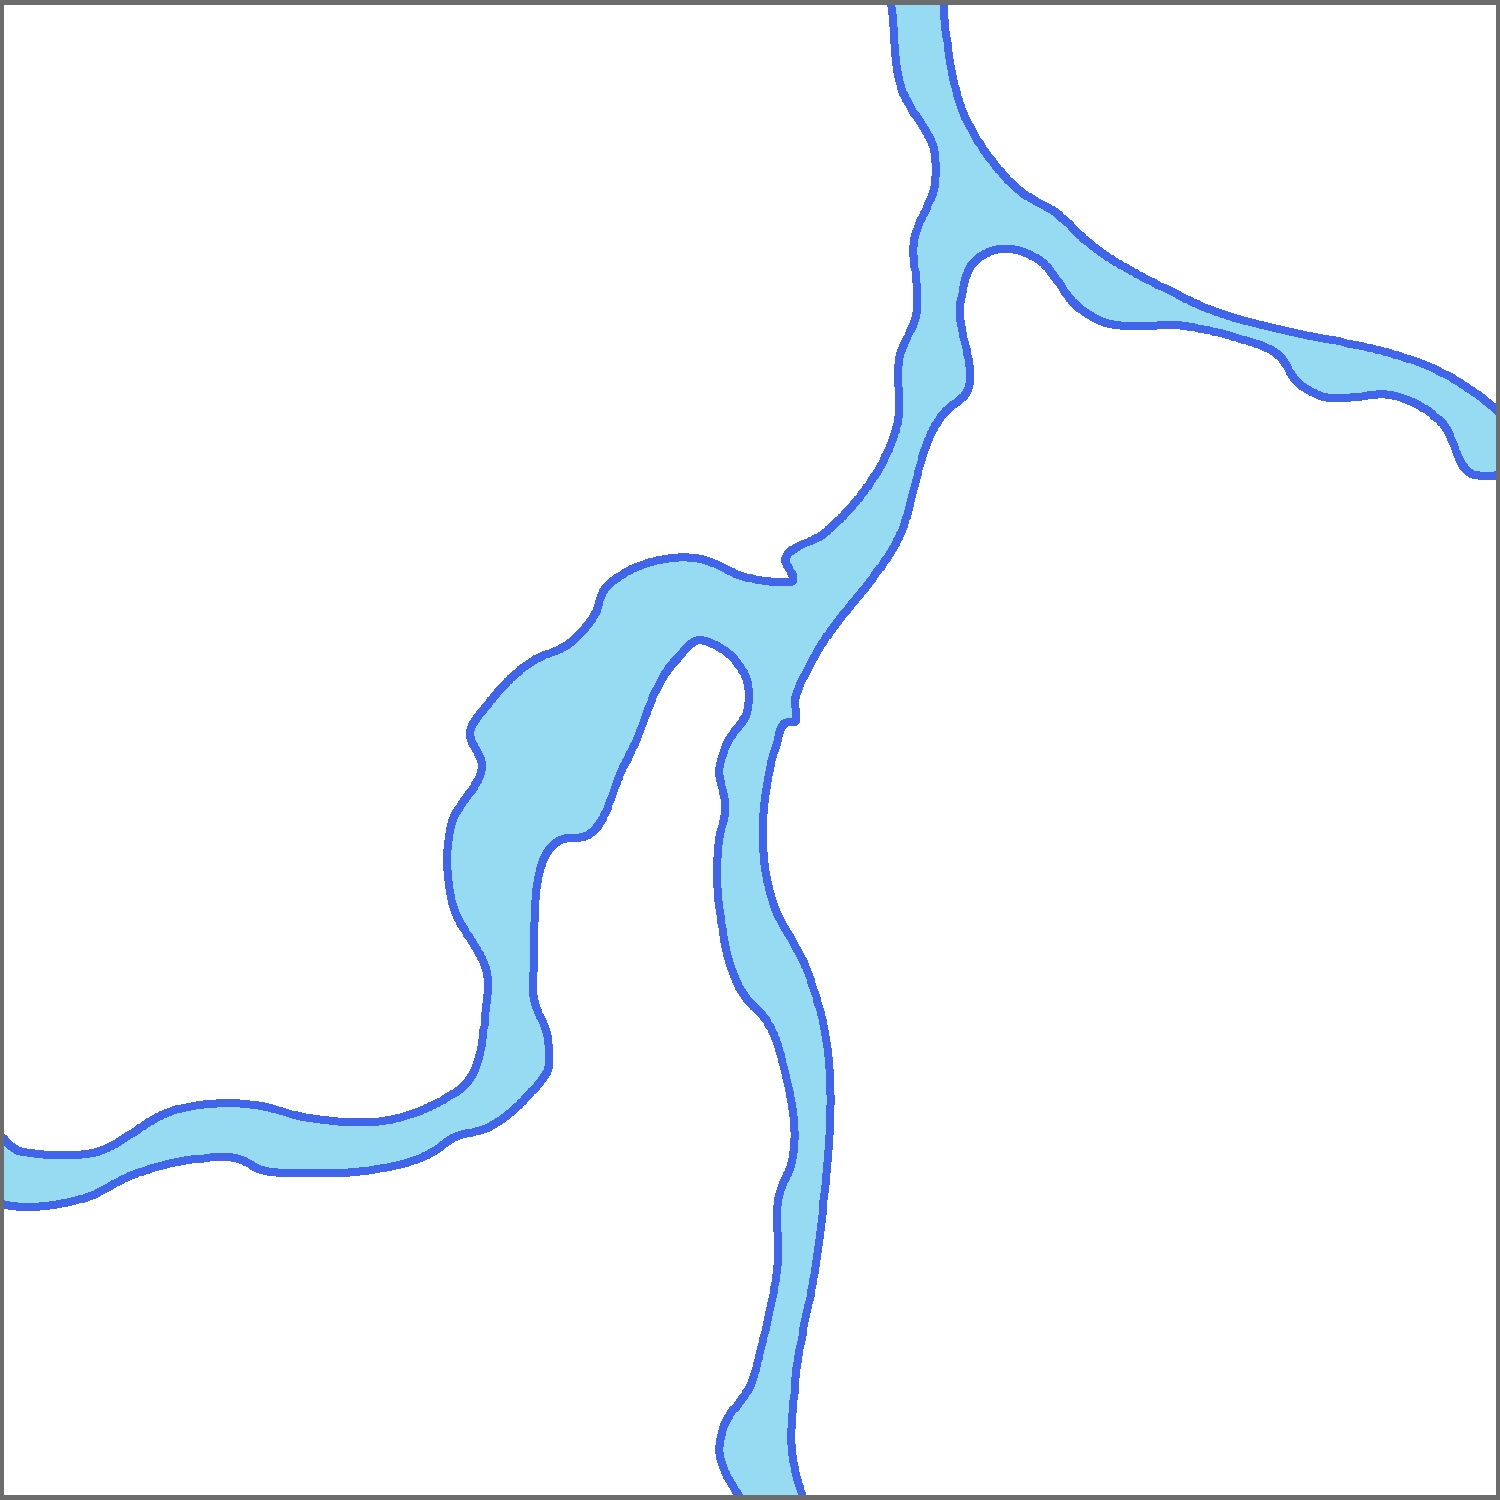
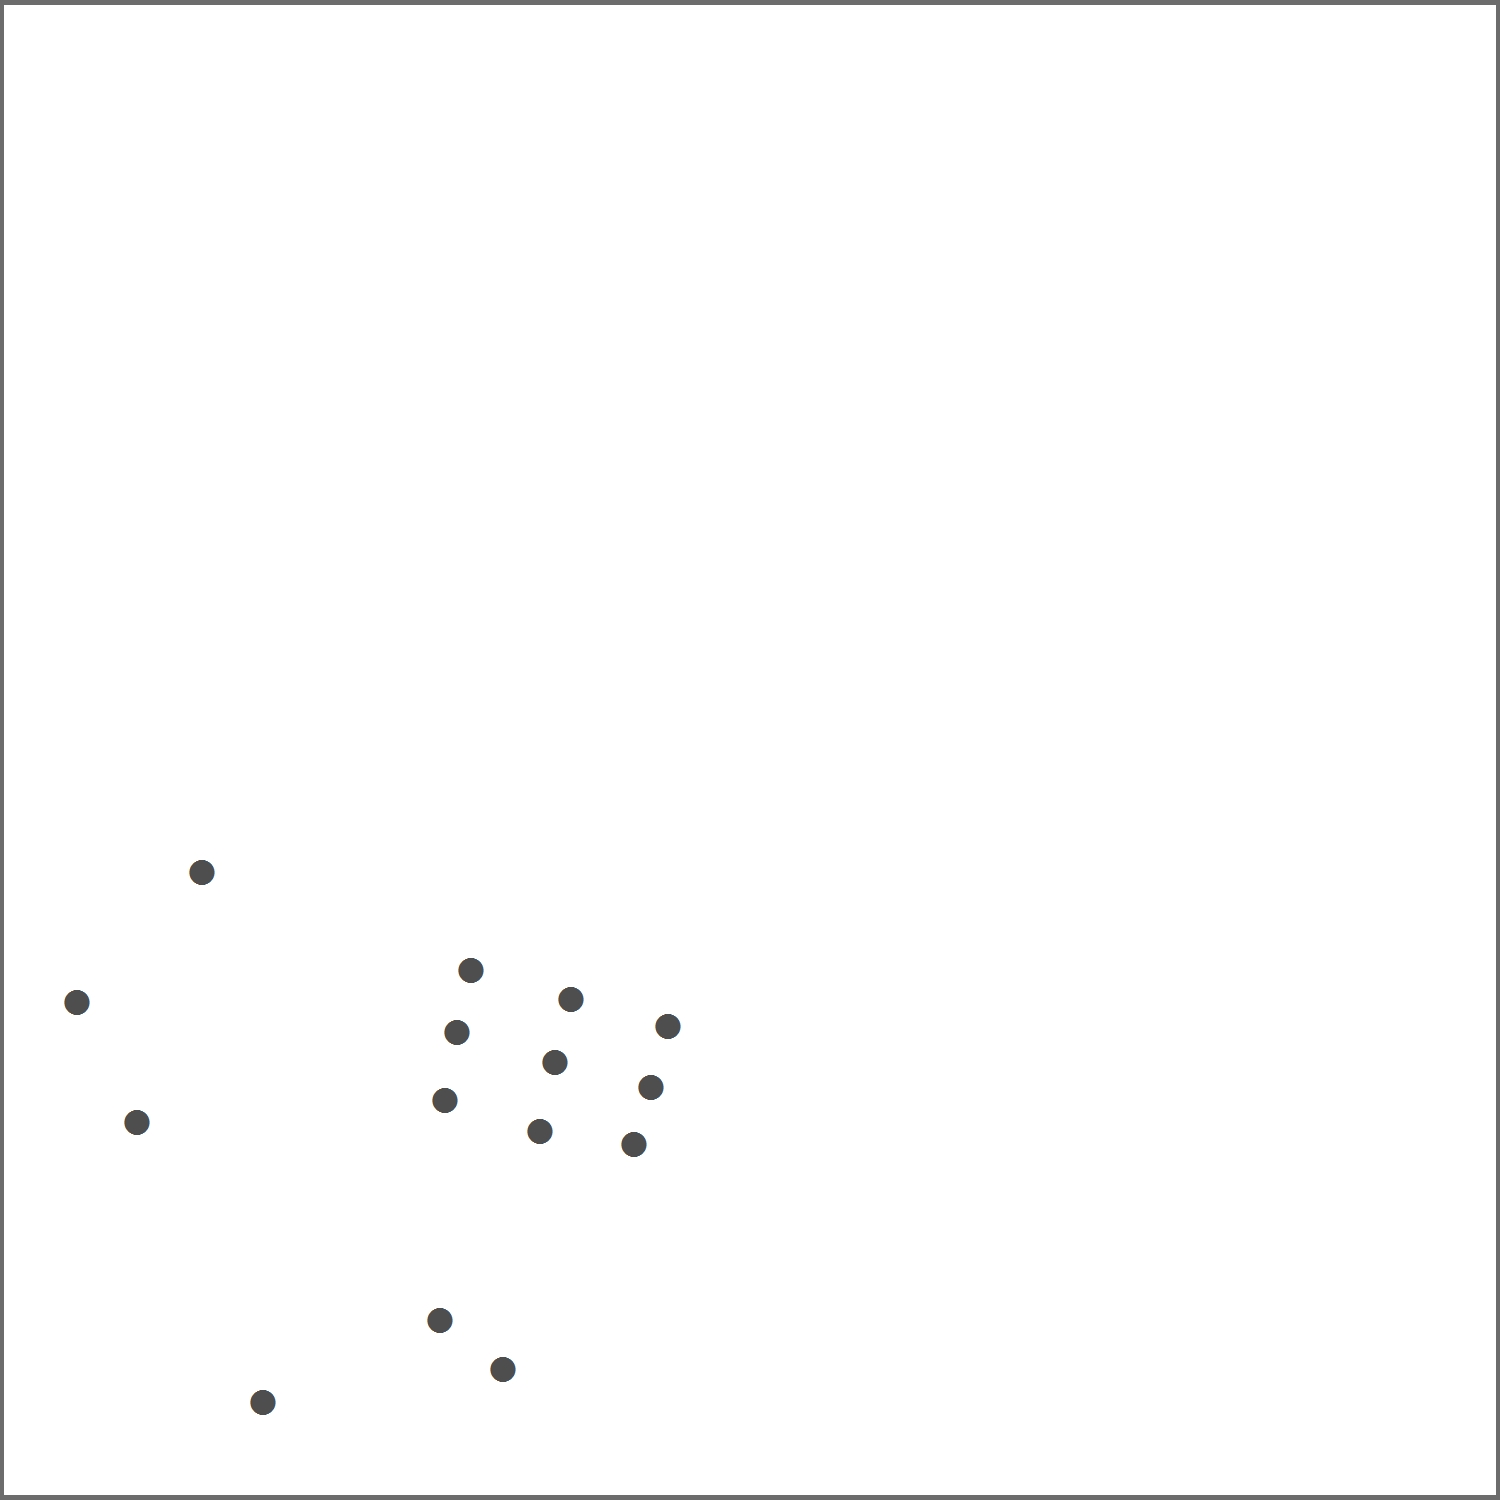
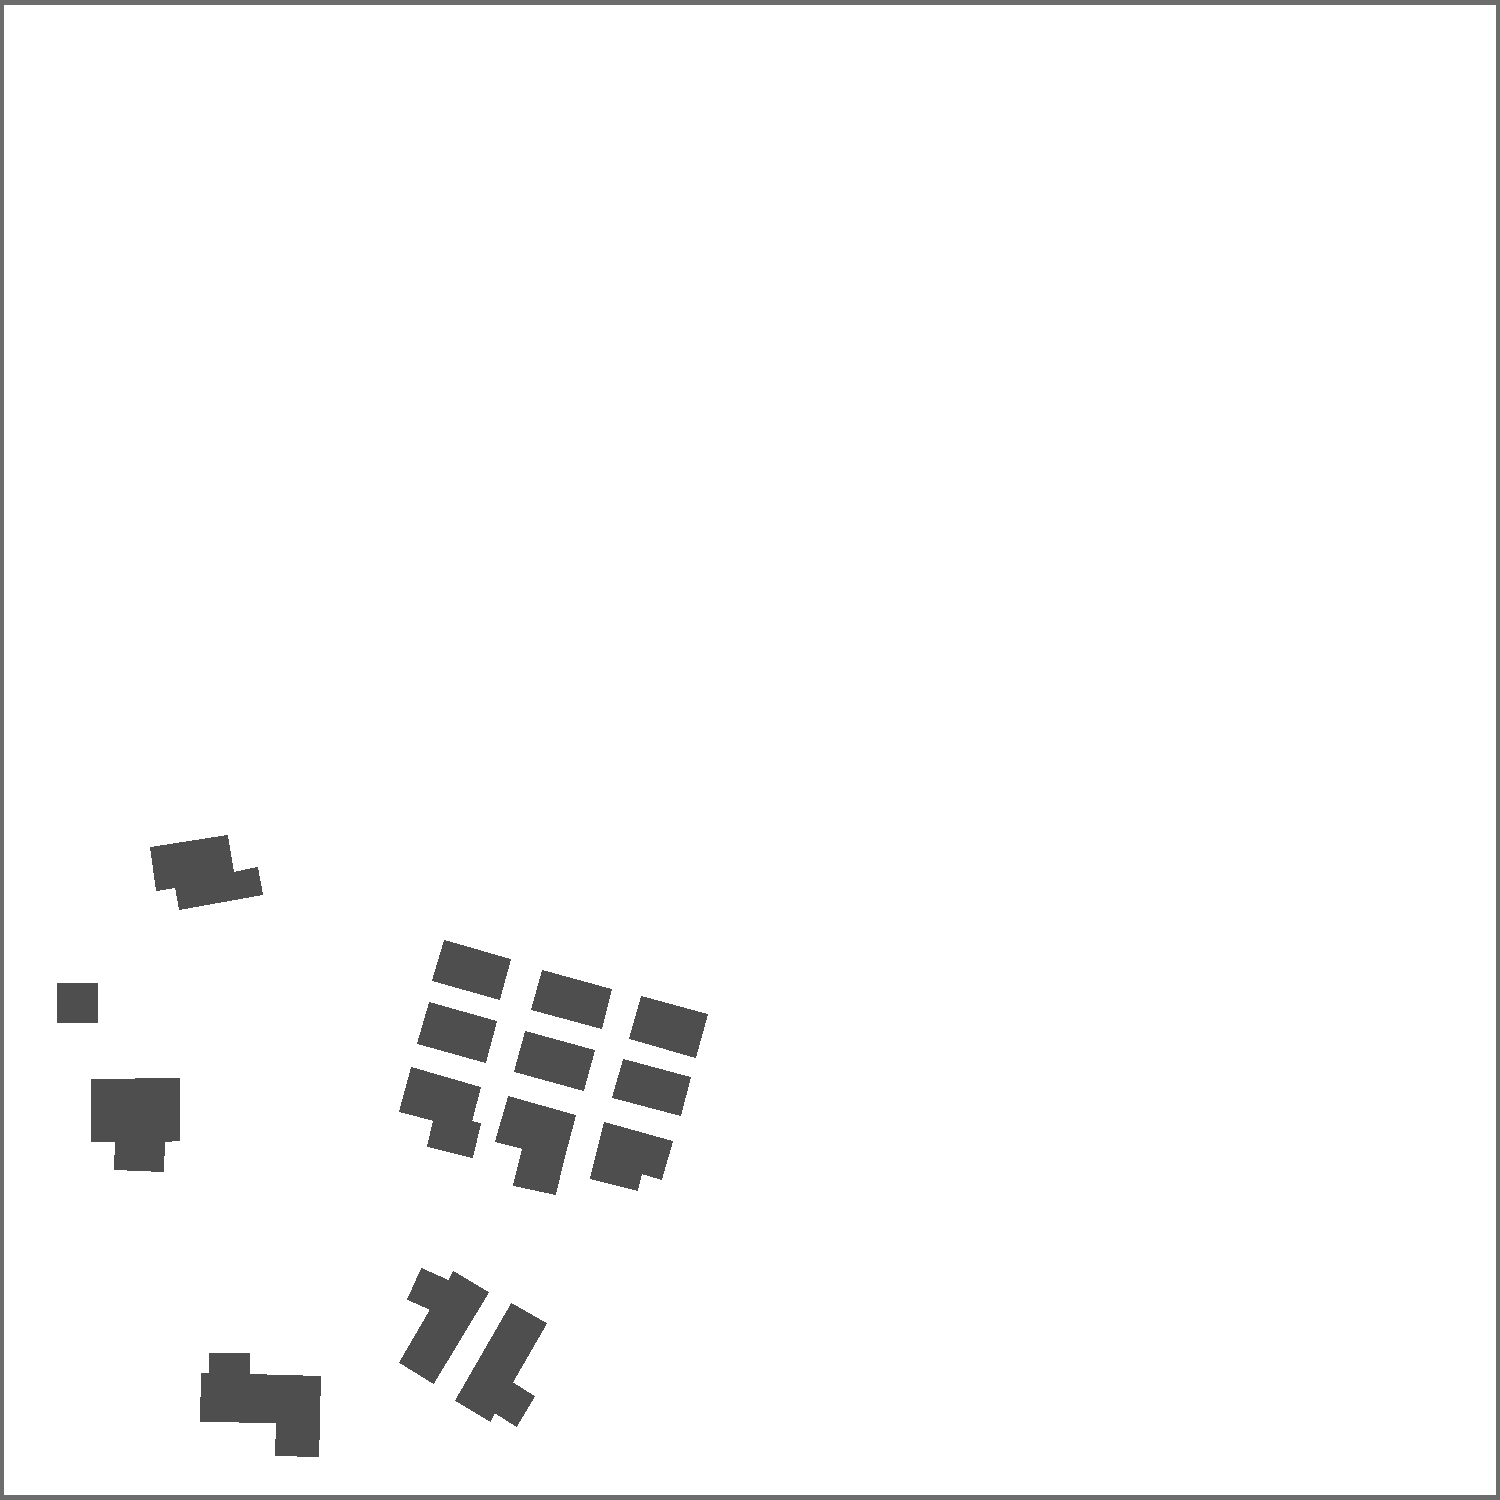
Figure 9: Hover cursor over graphic to view the results of collapsing features.
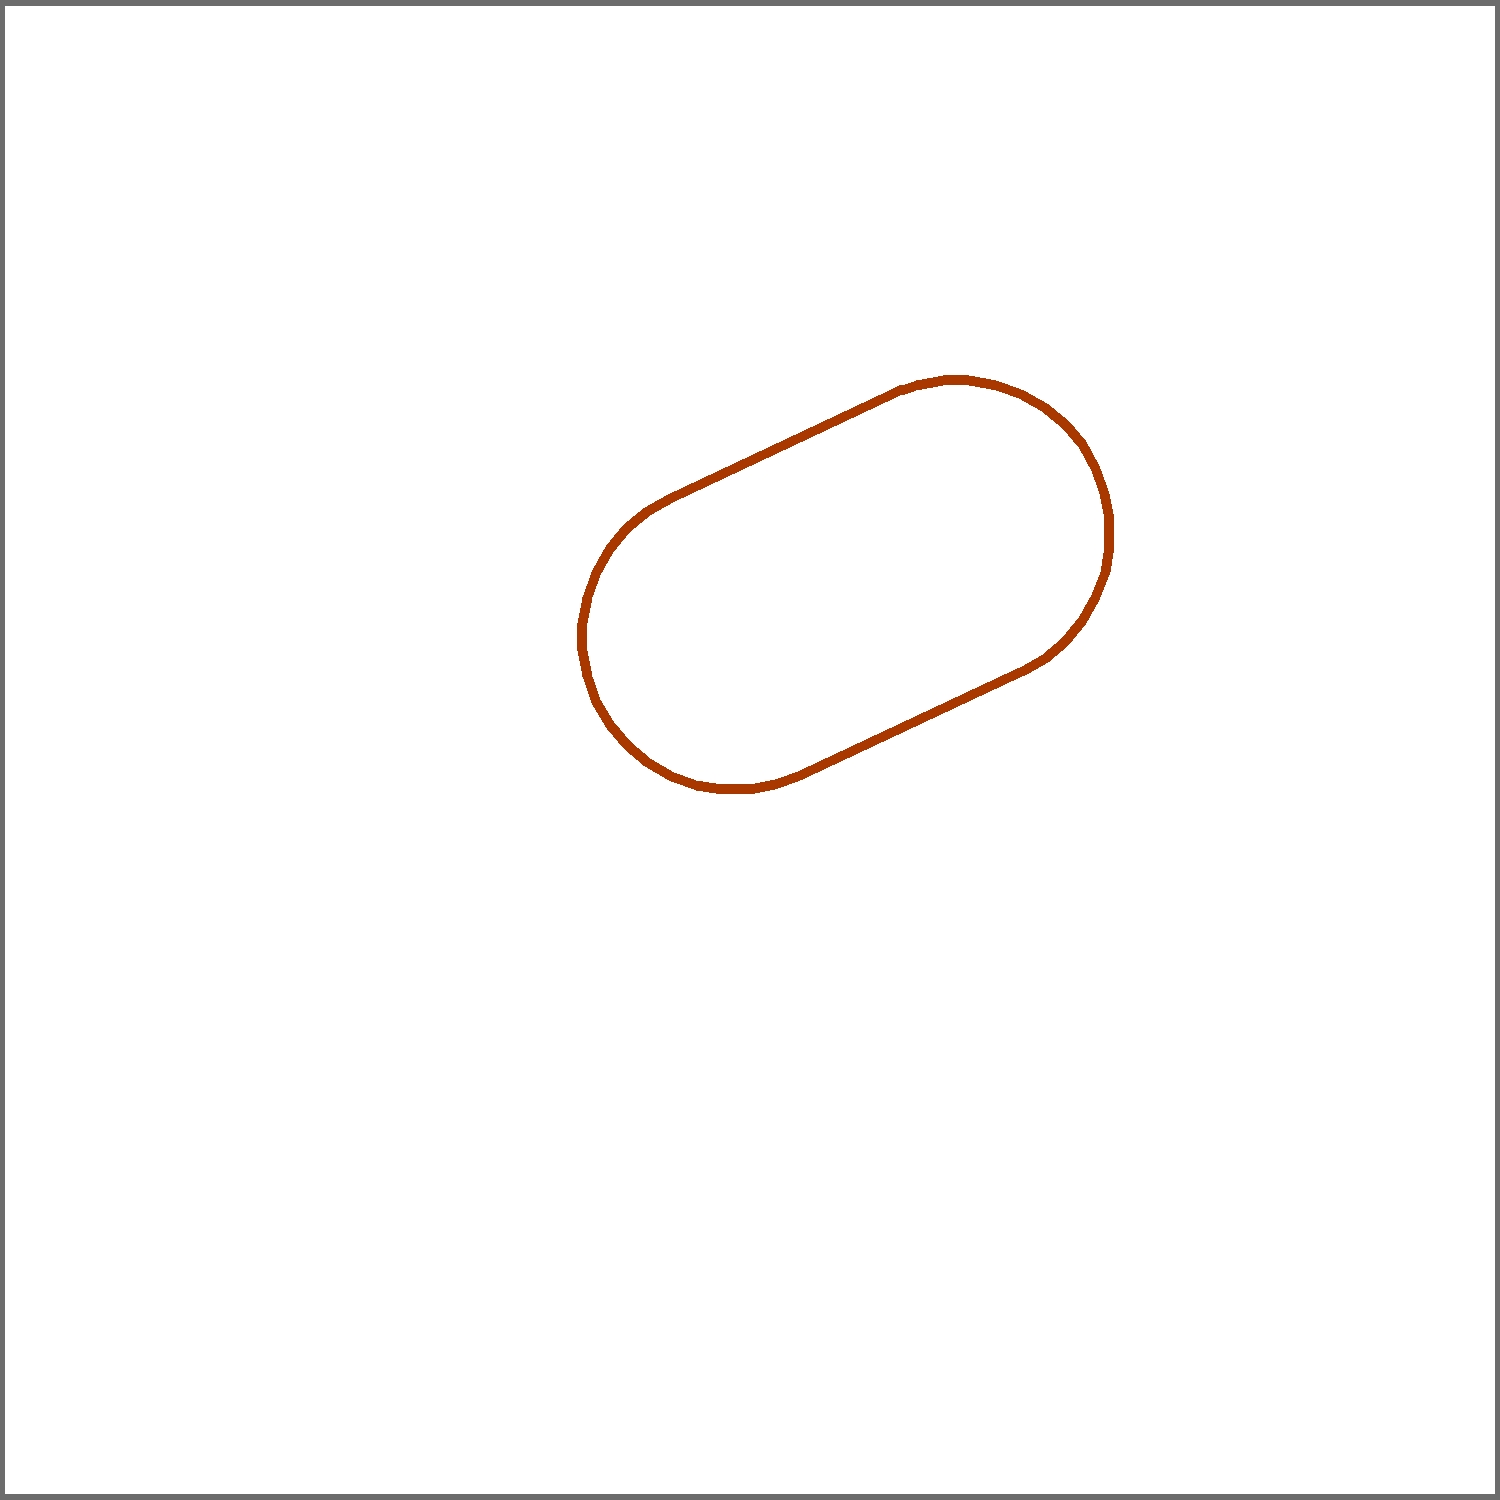
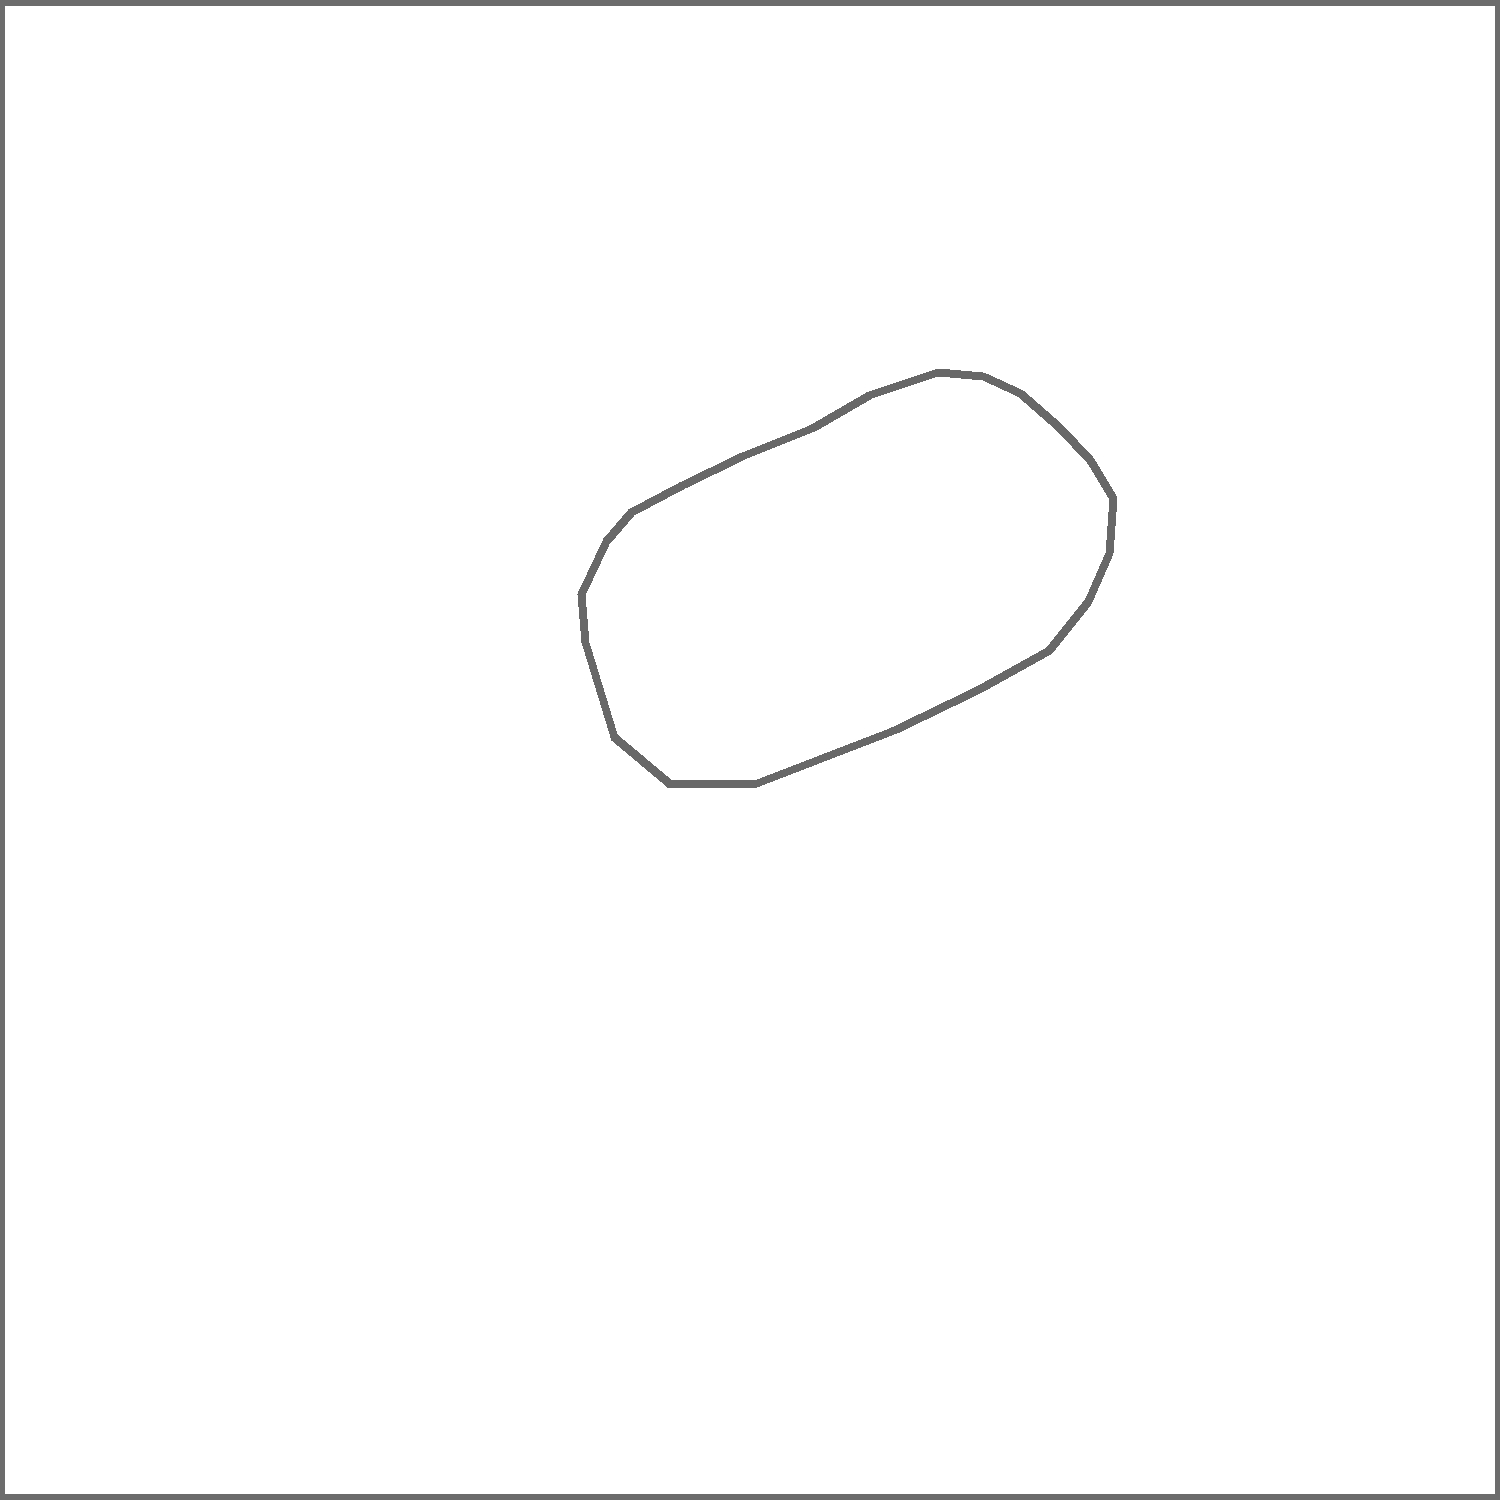
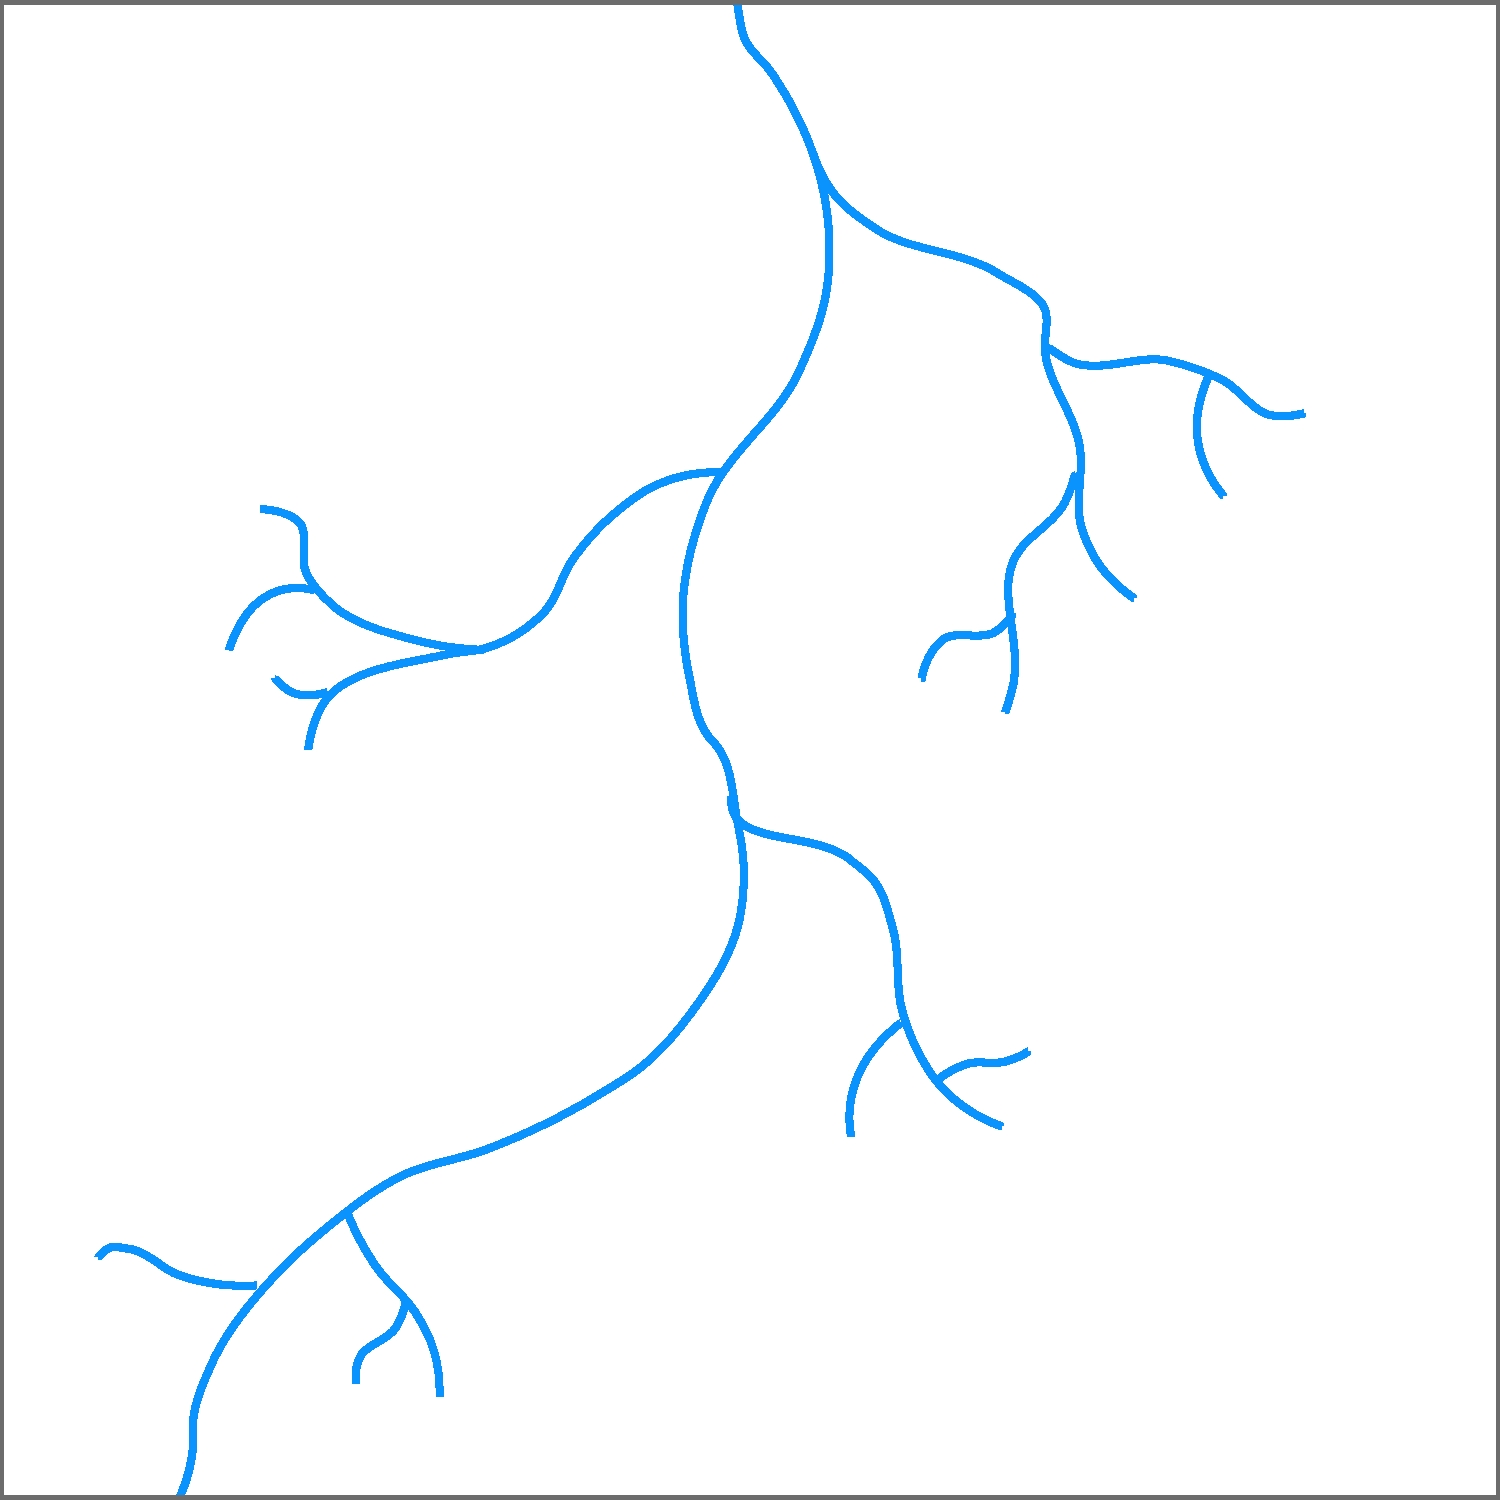
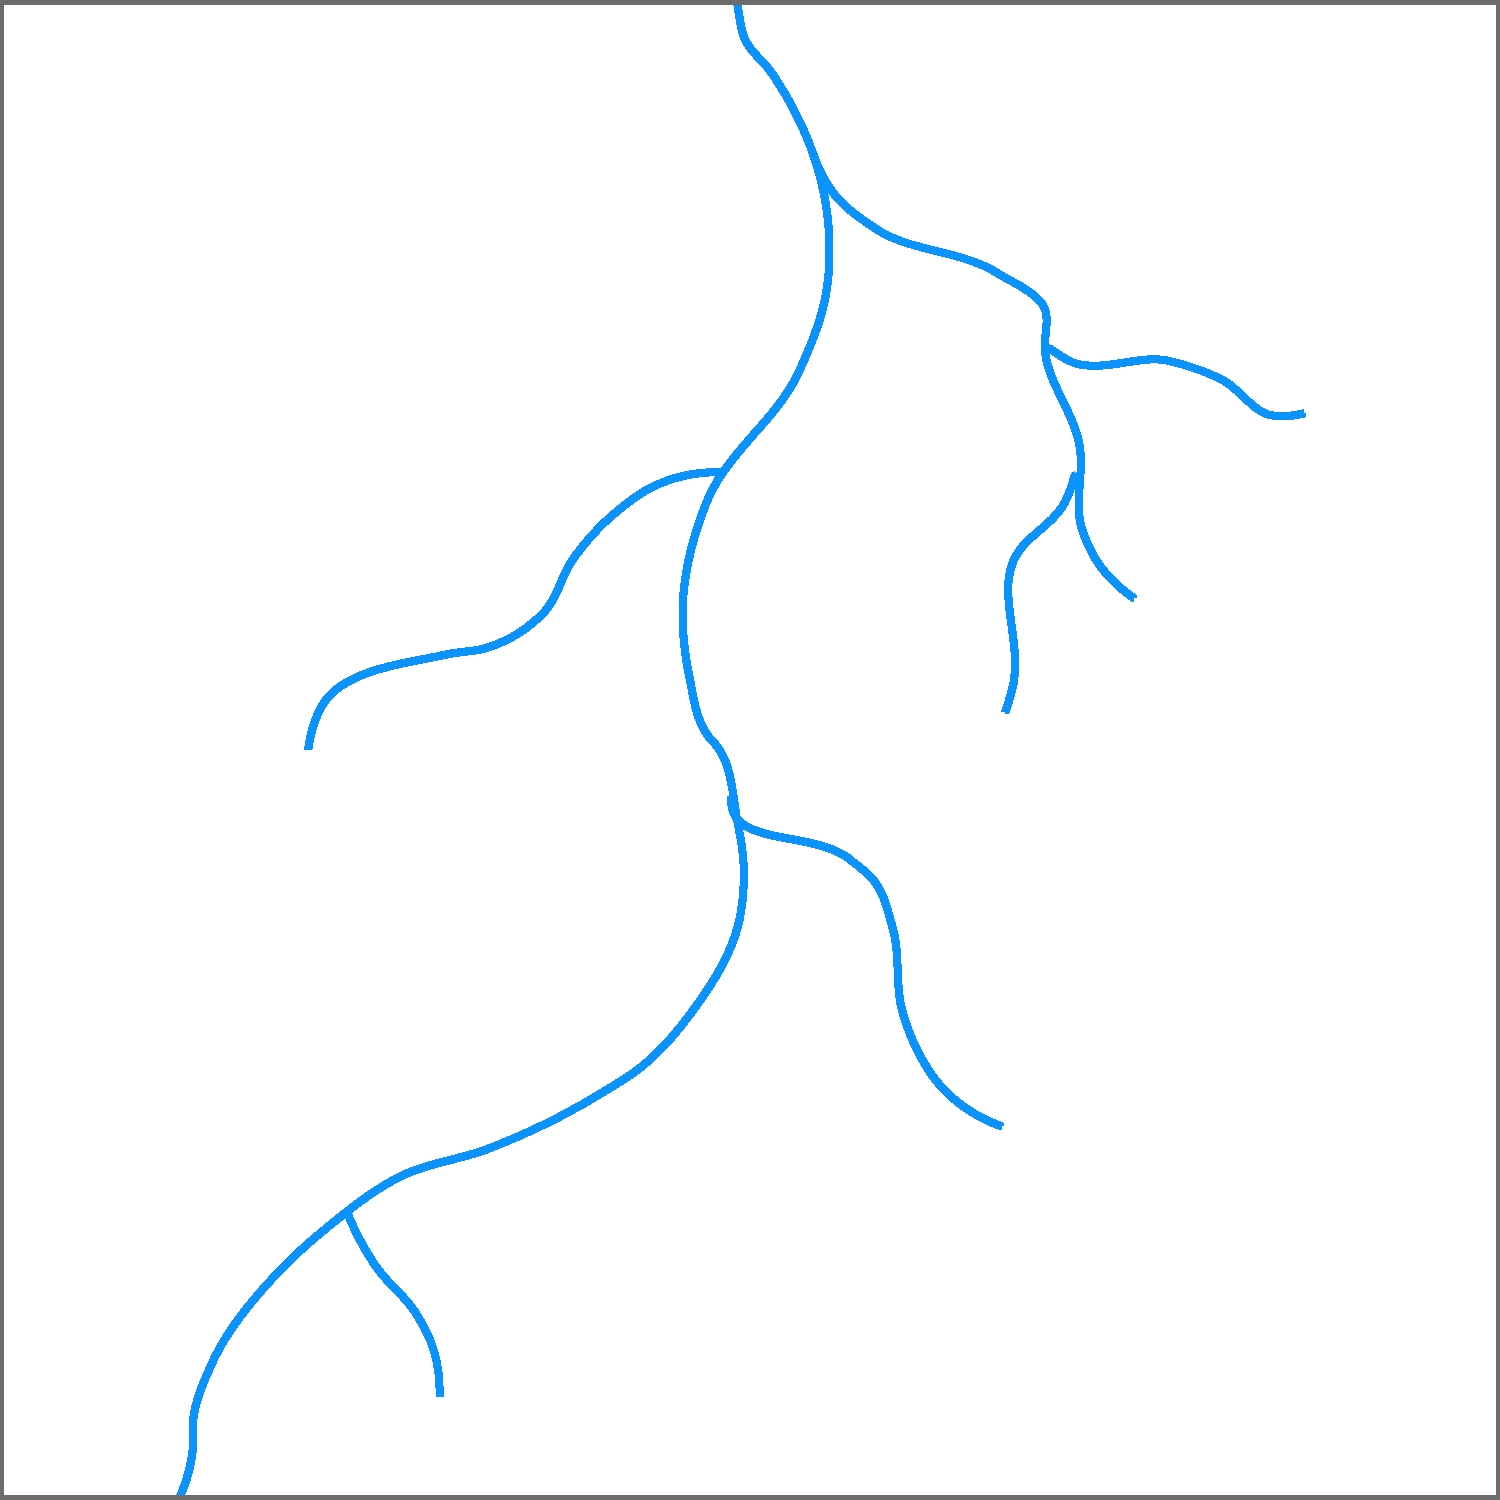
Figure 10: Hover cursor over graphic to view the results of refining a (left) digitized running track and (right) hydrographic network.
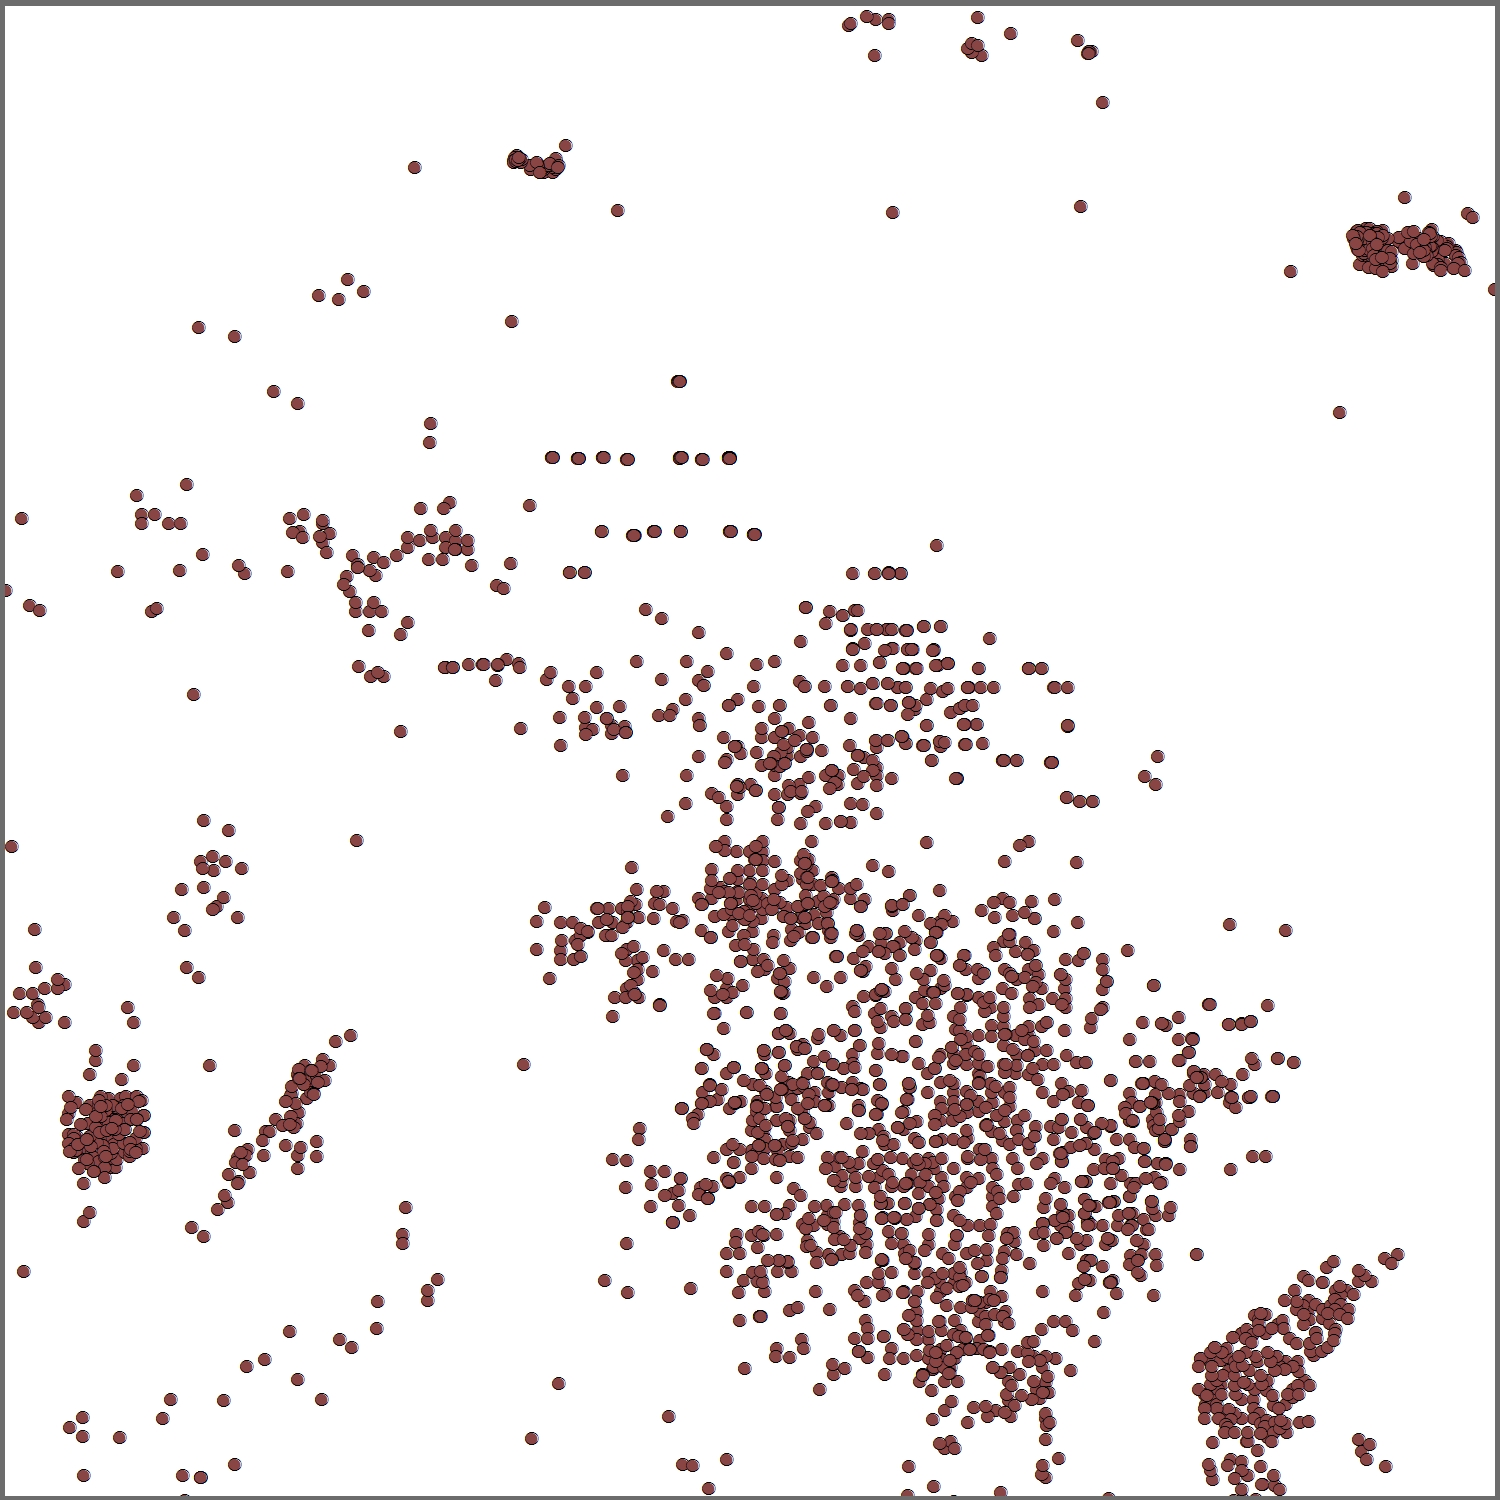
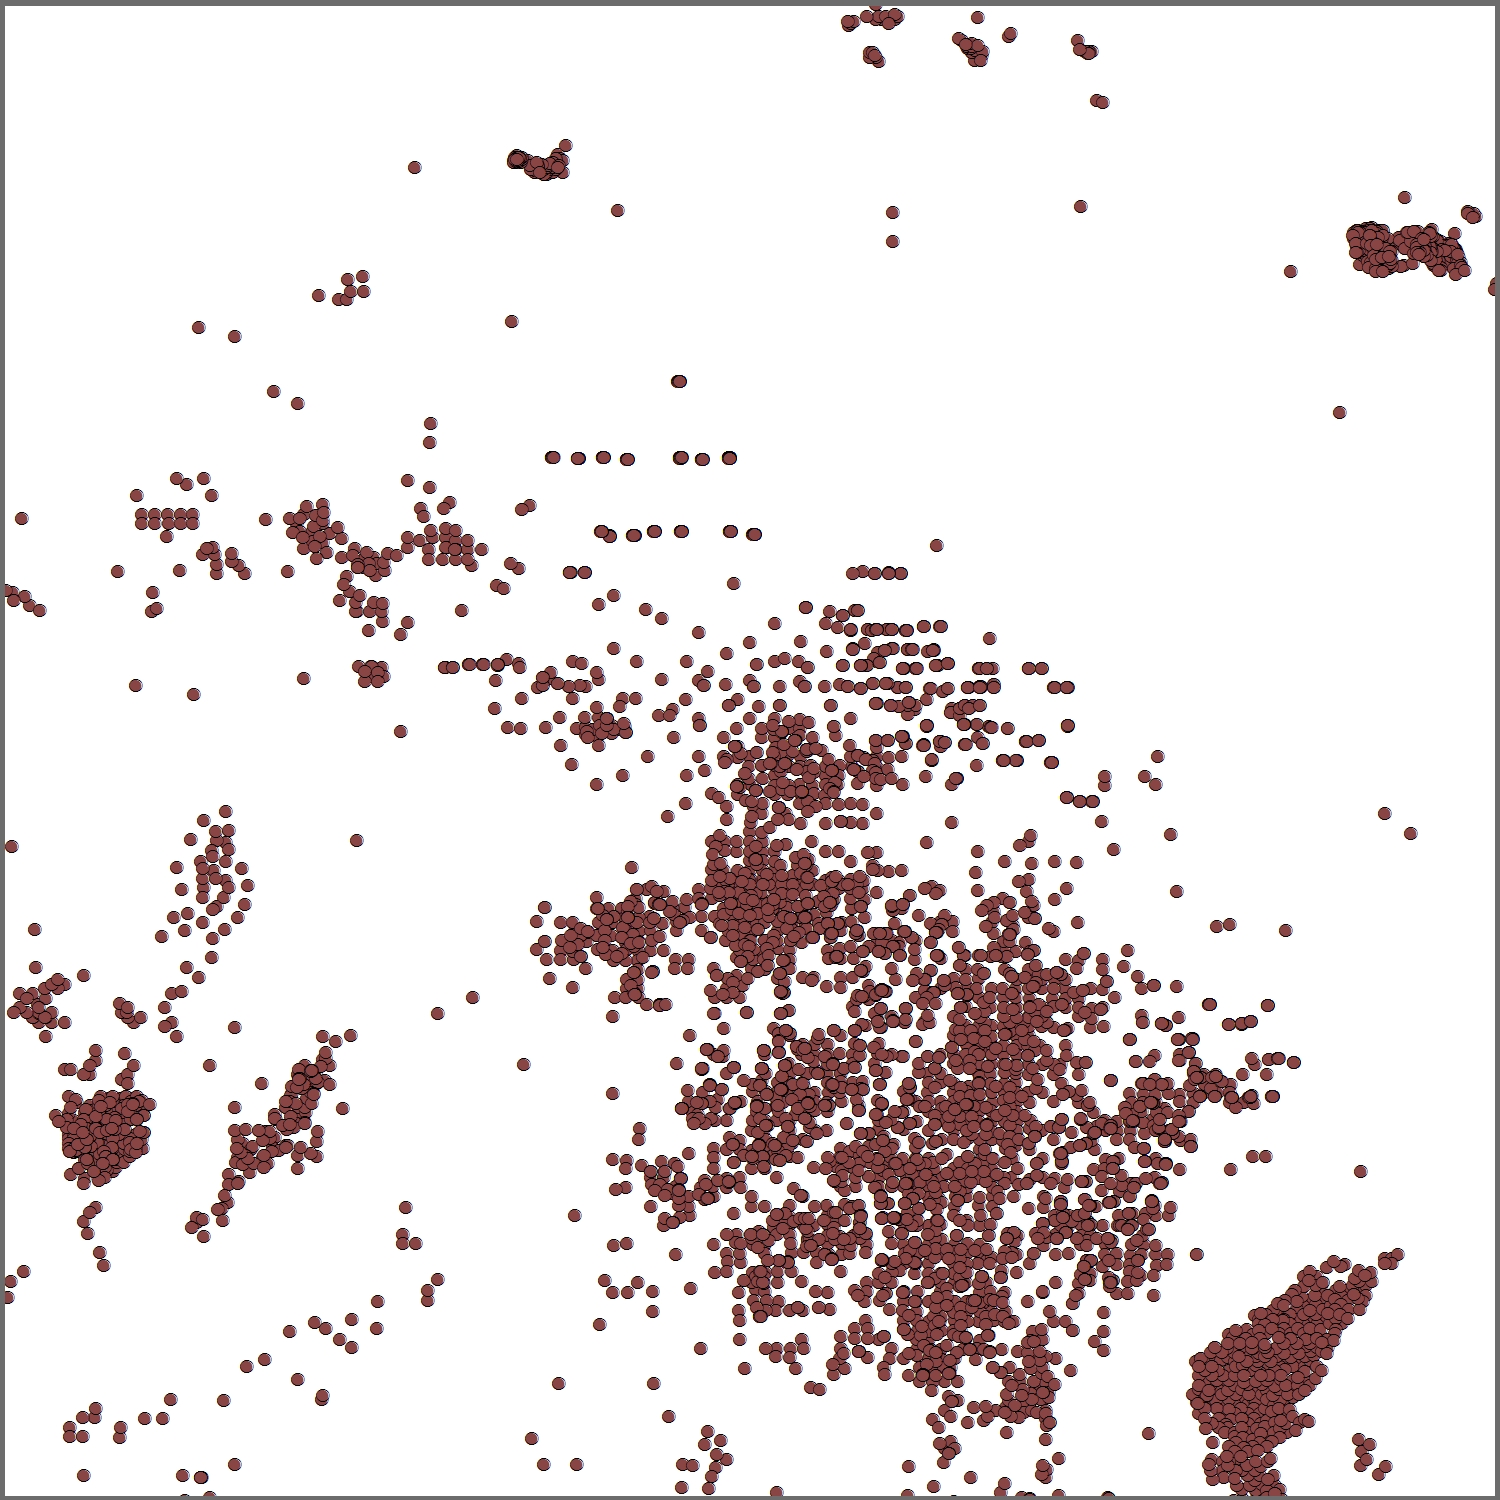
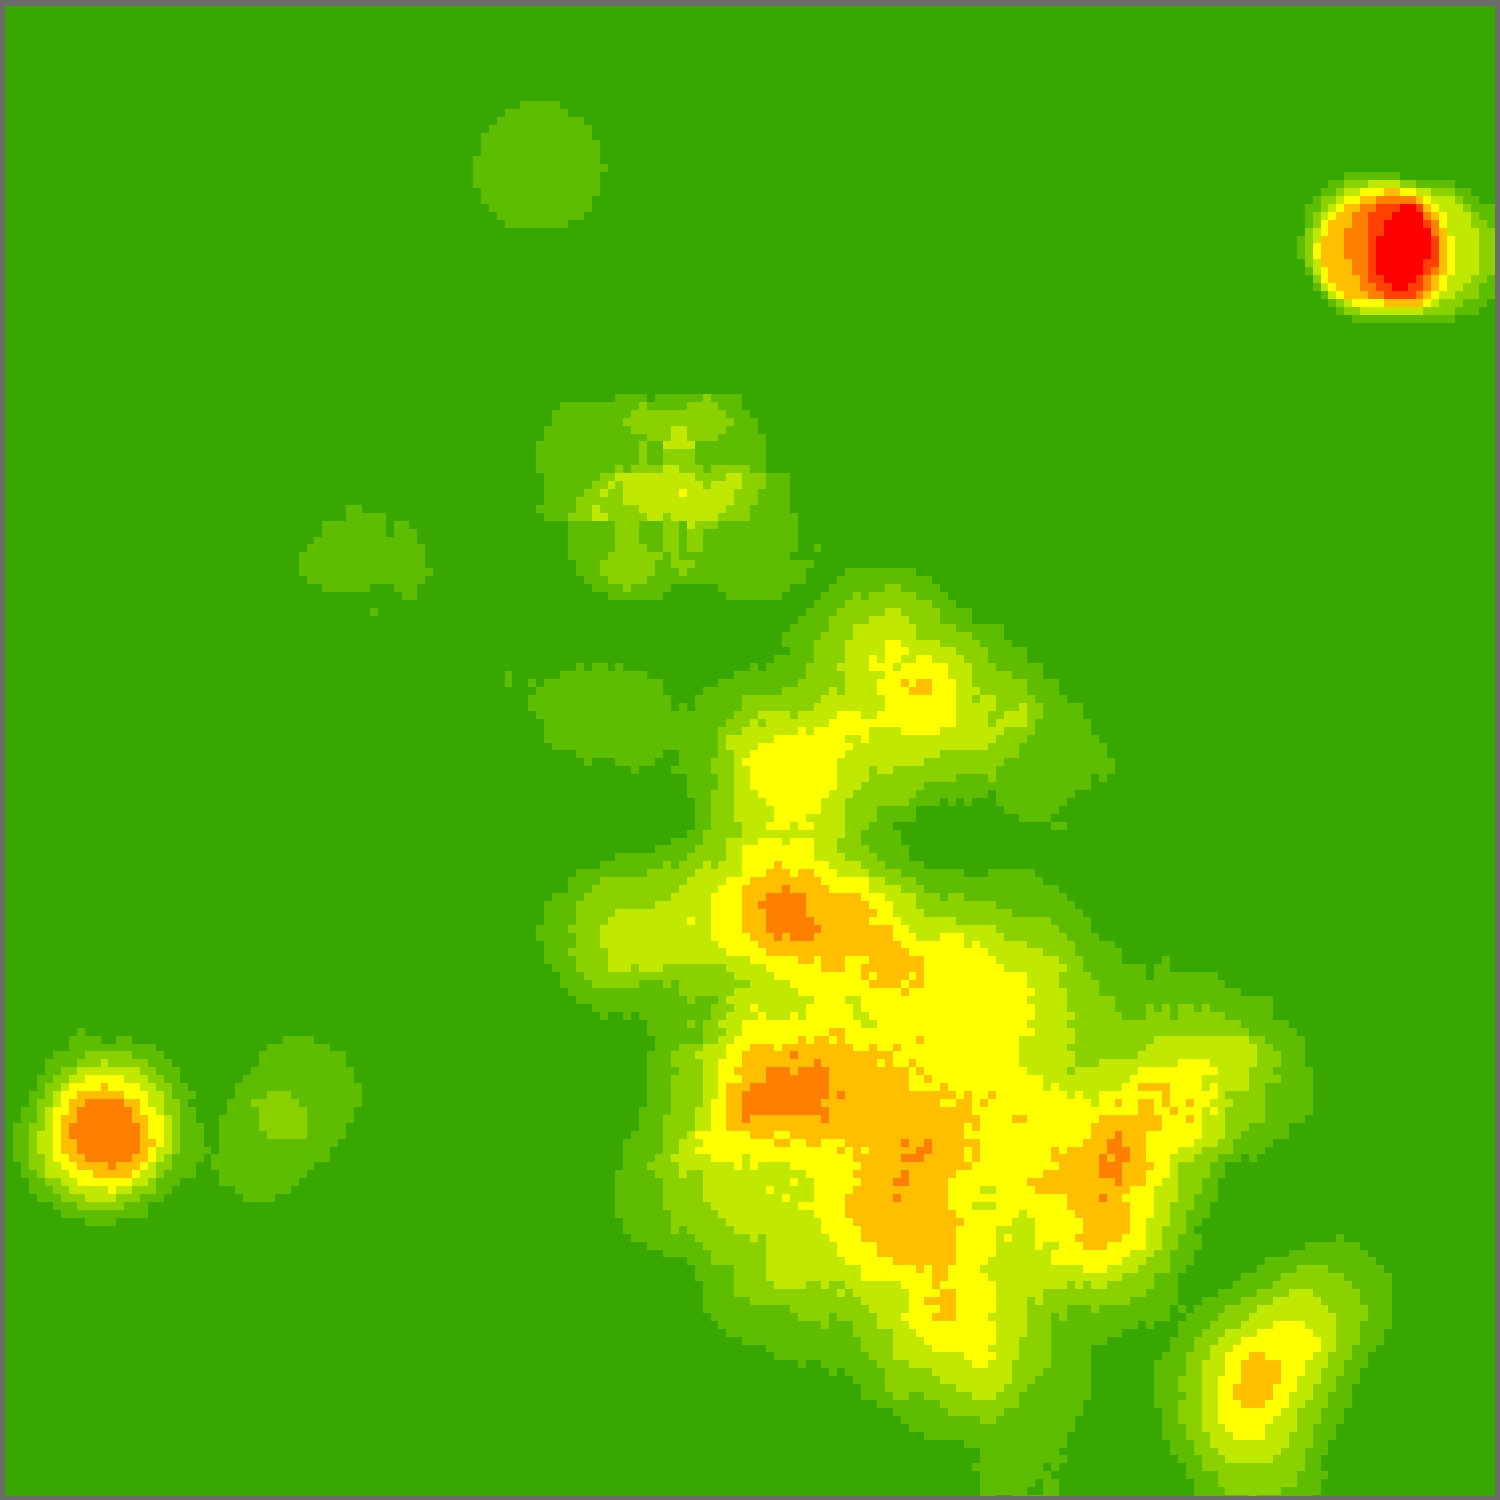
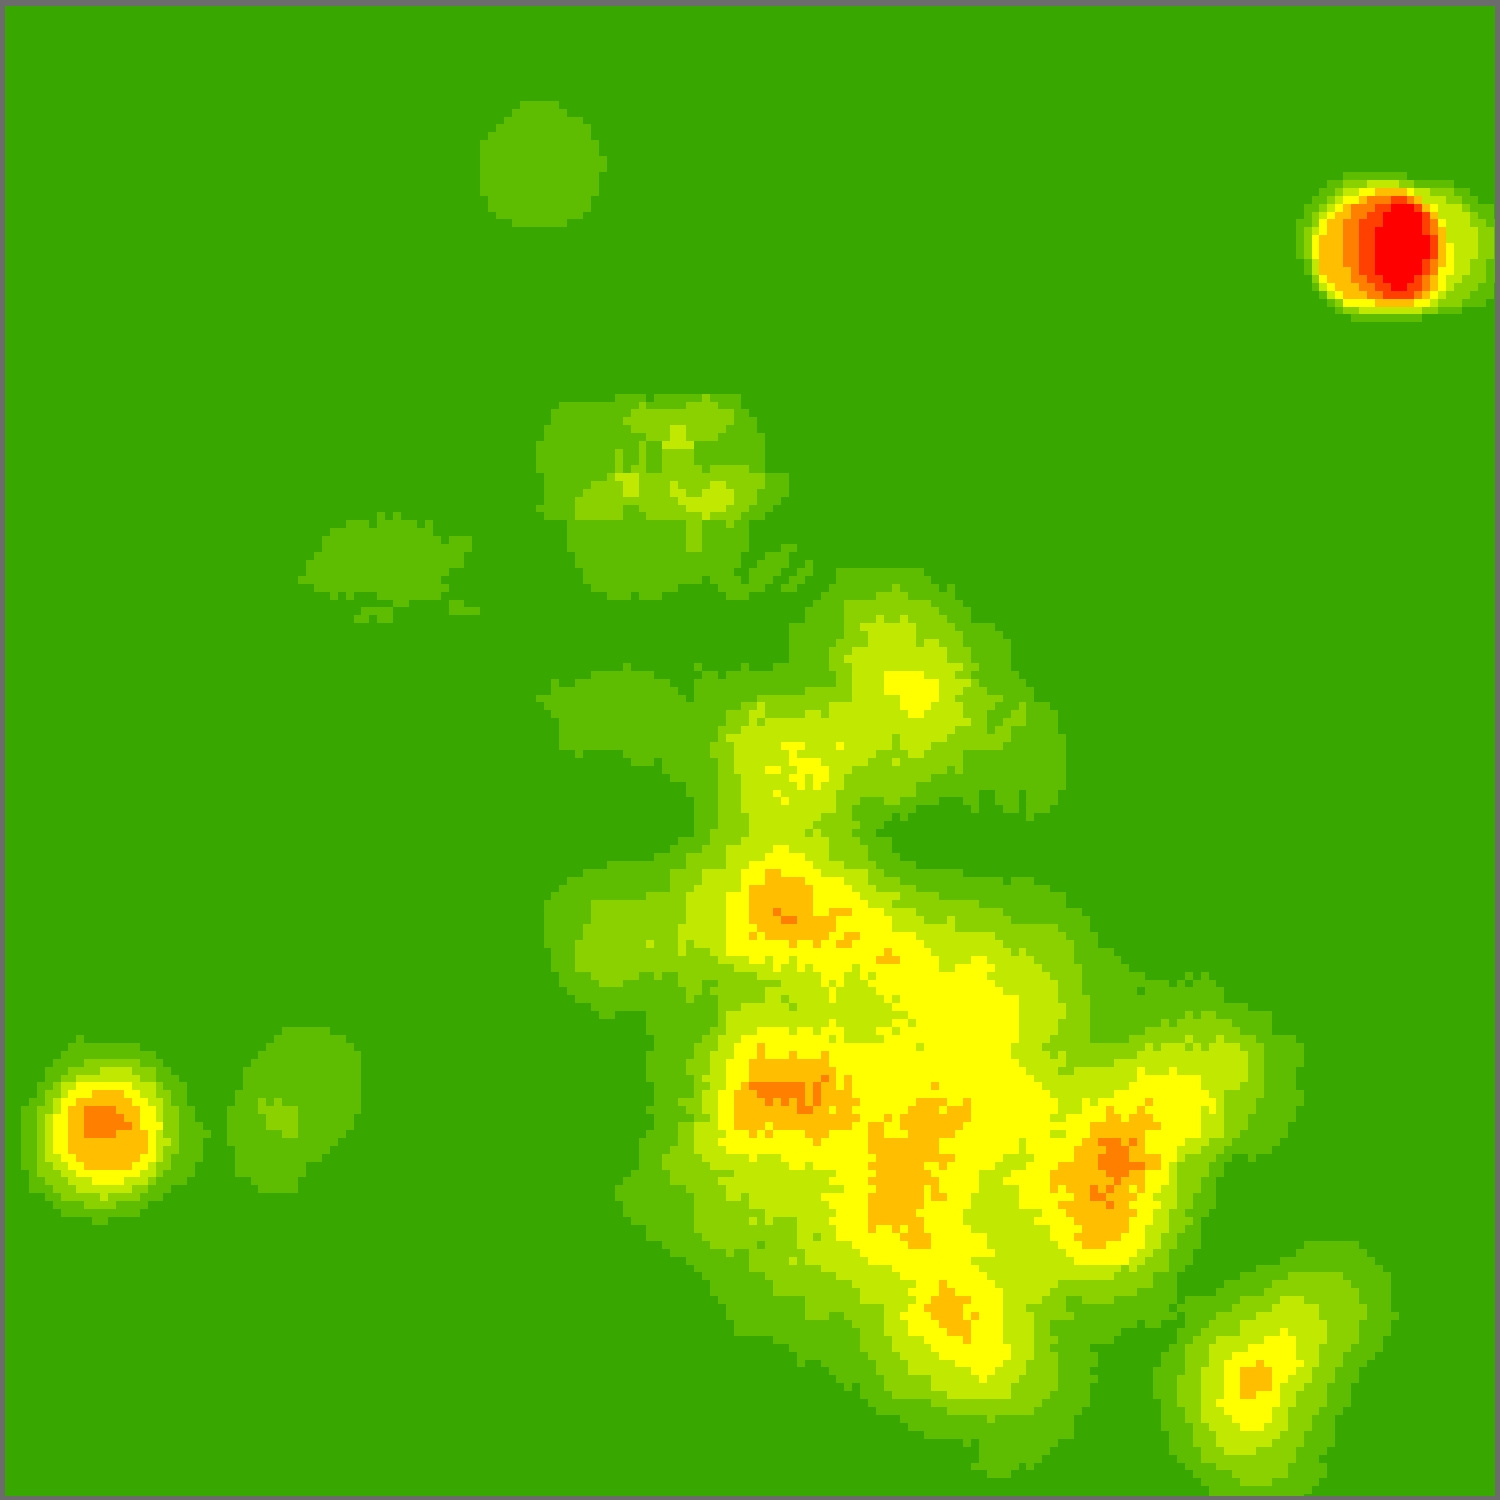
Figure 11: Hover cursor over first graphic to view the results of typification using 50% of the original points. The heat maps illustrate that the point density pattern is largely the same before and after typification (Data source: Wyoming Oil and Gas Conservation Commission).